Science with Passion

Application No.: VPH0080 Version 1 07/2024
CBD purification –
Part 1: Preparative HPLC method development in analytical scale and scale-up
J. Wesolowski, Y. Krauke, G. Greco; krauke@knauer.net
KNAUER Wissenschaftliche Geräte GmbH, Hegauer Weg 38, 14163 Berlin

Photo/Collage: KNAUER
Summary
The purification of compounds from natural sources can be achieved by various techniques, including single- and multi-column liquid chromatography. However, the development of efficient, fast and cost-effective methods for the purification of natural products from i.e. extracts can be a difficult and challenging task due to the complexity of the matrix. In contrast to conventional purification methods such as distillation, preparative chromatography uses less energy, consumes less water and chemicals while achieving higher yields [1].
In this application, a batch process for the purification of CBD (cannabidiol) from a CBD-rich cannabis extract was established. The application is devided into two Application Notes, first, an analytical method was developed and optimized. Second, CBD was purified using the scaled-up method on a preparative system.
Introduction
Liquid chromatography can be used for analytical applications as well as for preparative applications. Each is designed for a different purpose. While analytical HPLC is used to separate individual substances from a mixture for qualification and quantification, preparative HPLC is used to purify one or more substances.
As a chromatographic purification technique, batch processes are generally used. Ideally, the preparative method development is first carried out on an analytical scale before up scaling to the preparative process. First, after gaining initial chromatographic information about the sample using an overview gradient, the resolution around the target compound is optimized using a focus gradient. Therefore, a linear gradient with a flat slope is generated. This is followed by a volume and/or mass overloading study to determine the maximum column load before the dimensions are scaled-up to a preparative column. During scale-up, the process dimension is increased by larger column ID while keeping the separation parameters, such as the resolution, stable.
However, the calculations for the scale-up must be carried out precisely, as otherwise the final result cannot provide the same resolution as achieved at an analytical scale. Scaling up a chromatographic separation method can be complex overall due to the large number of interacting variables. The simplest scale-up, also known as linear scale-up, is performed with columns of identical chemistry, length and particle size, but different column inner diameters.
Due to the progressive decriminalization of cannabis for recreational and medicinal use, the properties of this controversial plant have gained increasing attention. To date, more than 500 phytochemicals have been identified in Cannabis sativa L. [2]. These include the medically important cannabinoids, but also terpenes, flavonoids and other components [3]. Cannabinoids are a group of terpenophenol compounds with a characteristic C21 framework (or C22 if they are present in acidic form), which are responsible for many therapeutic effects [4]. One of the most known cannabinoids, besides THC (tetrahydrocannabinol), is CBD. CBD has attracted a lot of attention in recent years due to its potential health benefits [5]. It is often used to relieve pain, inflammation and anxiety [5]. However, the purification of CBD and other cannabinoids from cannabis extracts presents a challenging task [6]. This is mainly due to the complexity of the matrix, which contains terpenes, waxes, chlorophylls and other cannabinoids [7]. In addition, the chemical structures and physical properties of cannabinoids are similar, making them difficult to separate. Therefore, specific methods and techniques are required to ensure accurate separation.
Here, the first part of the application note shows the establishment of an analytical method and the transfer of the method to the preparative scale, while the second part of the application note (VPH0081) shows the subsequent purification of CBD from a CBD-rich cannabis extract using a KNAUER AZURA® preparative HPLC system.
Sample Preparation
As a sample, an ethanol based cannabis extract was used. Before injection, the extract sample was filtered with a PTFE filter (0.20 µm). To determine the cannabinoids in the samples, individual cannabinoid standards were measured using the specific methods. For this purpose, the cannabinoid standards were prepared from 1 mg/ml cannabinoid standard solution (Sigma-Aldrich) and diluted with ethanol to the indicated concentration (20 µg/ml).
Results
Overview gradient
To obtain an overview of the retention behavior of the cannabinoids a gradient method was created first in analytical scale on a C18 column with 5 µm particle size. For this purpose, the gradient was divided into four steps. After injection, an isocratic hold step was used to optimize the resolution. The second step was a linear slop which was used to separate the target component, followed by a wash step. In the last step, the column was re-equilibrated with the original solvent composition for the next sample analysis. In addition to different eluent B (ethanol [EtOH], acetonitrile [ANC] and methanol [MeOH]), also columns of different lengths (150 mm and 250 mm) were tested. The gradient of the long column was proportionally adapted to the short column to enable a better comparison. In Fig. 1, the chromatogram with ethanol as eluent B is shown, while Fig. 2 represents the chromatogram using acetonitrile and Fig. 3 illustrates the chromatogram using methanol.

Fig. 1 Chromatograms of the overview gradient with EtOH as eluent B. Sample: CBD-rich cannabis extract; green: ES II 100-5 C18 150 x 4 mm; blue: ES II 100-5 C18 250 x 4 mm; dashed lines: gradient; 228 nm; 10 µl injection.

Fig. 2 Chromatograms of the overview gradient with ACN as eluent B. Sample: CBD-rich cannabis extract; green: ES II 100-5 C18 150 x 4 mm; blue: ES II 100-5 C18 250 x 4 mm; dashed lines: gradient; 228 nm; 10 µl injection.

Fig. 3 Chromatograms of the overview gradient with MeOH as eluent B. Sample: CBD-rich cannabis extract; green: ES II 100-5 C18 150 x 4 mm; blue: ES II 100-5 C18 250 x 4 mm; dashed lines: gradient; 228 nm; 10 µl injection.
The retention times for CBD, ∆9-THC and CBC are shown in Tab. 1.
Tab. 1 Retention times for CBD, ∆9-THC and CBC using different eluent B and column lengths.

The elution order of the three cannabinoids did not change with different eluents and column length. CBD eluted first, then Δ9-THC followed by CBC. Shorter retention times were observed with EtOH/H2O as mobile phase and longer retention times with MeOH/H2O (Tab. 1). A closer look at the chromatograms of the ethanol elution (Fig. 4) shows that although a longer column requires a longer measurement time, the separation in the area of the target peak (CBD peak) is significantly better. Based on these results, the ES II 100-5 C18 250 x 4 mm column was used for further measurements.

Fig. 4 Chromatogram cutout of the overview gradient with EtOH as eluent B. Sample: CBD-rich cannabis extract; * CBD; green: ES II 100-5 C18 150 x 4 mm; blue: ES II 100-5 C18 250 x 4 mm; 228 nm; 10 µl injection.
Focused gradient
After the determination of the elution point of the CBD (Tab. 1), a zone around this peak was defined in which a linear gradient with a flat slope was applied to optimize the resolution around the target peak. For the calculation of the new gradient, the Focused Gradient Calculator was used [8]. The chromatograms of the focused gradient with the three different eluent compositions are shown in the following three figures (Fig. 5, Fig. 6, Fig. 7). After applying the focus gradient, the chromatograms showed a better separation around the target peak. Additionally, the runtime was reduced. The chromatogram in Fig. 5 shows the result of using EtOH/H2O as eluent, where CBD was separated most efficiently from the other substances. In addition, ethanol is less toxic and hazardous compared to acetonitrile and methanol. Based on the results, ethanol was used as eluent B for all subsequent measurements.

Fig. 5 Chromatogram of the focus gradient with EtOH as eluent B. Sample: CBD-rich cannabis extract; blue: ES II 100-5 C18 250 x 4 mm; dashed line: gradient; 228 nm; 10 µl injection.

Fig. 6 Chromatogram of the focus gradient with ACN as eluent B. Sample: CBD-rich cannabis extract; blue: ES II 100-5 C18 250 x 4 mm; dashed line: gradient; 228 nm; 10 µl injection.

Fig. 7 Chromatogram of the focus gradient with MeOH as eluent B. Sample: CBD-rich cannabis extract; blue: ES II 100-5 C18 250 x 4 mm; dashed line: gradient; 228 nm; 10 µl injection.
Method optimization and overload studies
After completion of the screening, the method was transferred to a C18 column of similar length and inner diameter, but larger particle size of 15 μm, corresponding to the particle size of the preparative column. By using the later preparative particle size in analytical scale, the developed method can directly be transferred to preparative scale by a linear scale-up. The optimization was carried out on the gradient and are shown schematically in the flowchart (Fig. 8). The gradient was adjusted to achieve the shortest possible runtime with improved resolution and the lowest possible eluent consumption.
With the optimized step gradient method, the run time was halved, and the eluent consumption was reduced by around 50 % while keeping the same resolution. The development of a preparative method for CBD purification on an analytical scale was completed.
After method optimization in analytical scale, a volume overload study was performed with the extract sample to determine the maximum injection volume without loss of chromatographic resolution. Fig. 9 shows the injection of increasing sample volumes on the analytical column in an overlay plot. The focus was placed on the retention behaviour of CBD. All experiments showed a clear peak broadening. The lowest resolution was observed with an injected volume of 100 µl. Furthermore, the peaks no longer showed the shape of a Gaussian bell curve.

Fig. 8 Flowchart method optimization.

Fig. 9 Overlay chromatograms in analytical overload tests. Sample: CBD-rich extract sample; black: 10 µl; red: 25 µl, blue: 50 µl; green: 100 µl; ES II 100-15 C18 250 x 4 mm; 1 ml/min; 228 nm.
The analytical UV flow cell with 10 mm path length, and 10 µl volume was then replaced by a semi-preparative UV flow cell with 3 mm path length and 2 µl volume for the final method (Fig. 10). The change was made for two reasons:
- the maximum flow rate for the analytical UV flow cell was too small for the future measurements on the preparative scale, and
- the detector is at the detection limit, therefore a smaller path length and cell volume is used to reduce the sensitivity.

Fig. 10 Chromatogram of the analytical measurement with different flow cells. Sample: CBD-rich extract sample; black: analytical 10 mm UV flow cell with 10 µl volume; gold: semi-preparative 3 mm UV flow cell with 2 µl volume; ES II 100-15 C18 250 x 4 mm; 1 ml/min; 10 µl injection.
Scale up
Under consideration of the void volumes of both systems, a linear scale-up of the final method was performed to increase the yield. For this purpose, the inner diameter (ID) of the column was increased from 4 to 20 mm, while keeping the particle size and column length constant. Subsequently, the scale-up factor (SF) could be calculated using equation (1).
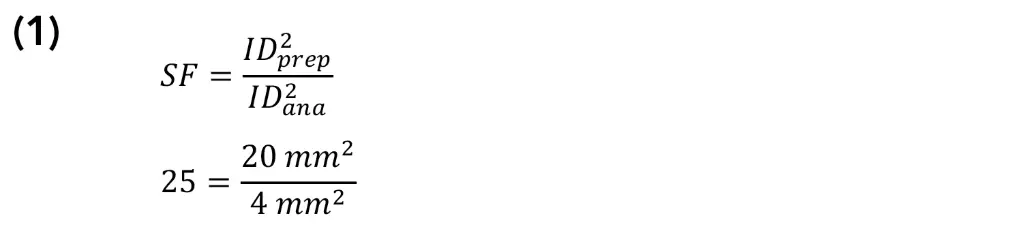
With the calculated scale-up factor of 25 the flow rate increase from 1 ml/min to 25 ml/min and the injection volume was scaled from 10 µl to 250 µl. Afterwards, the gradient was adjusted using equation (2) [9].
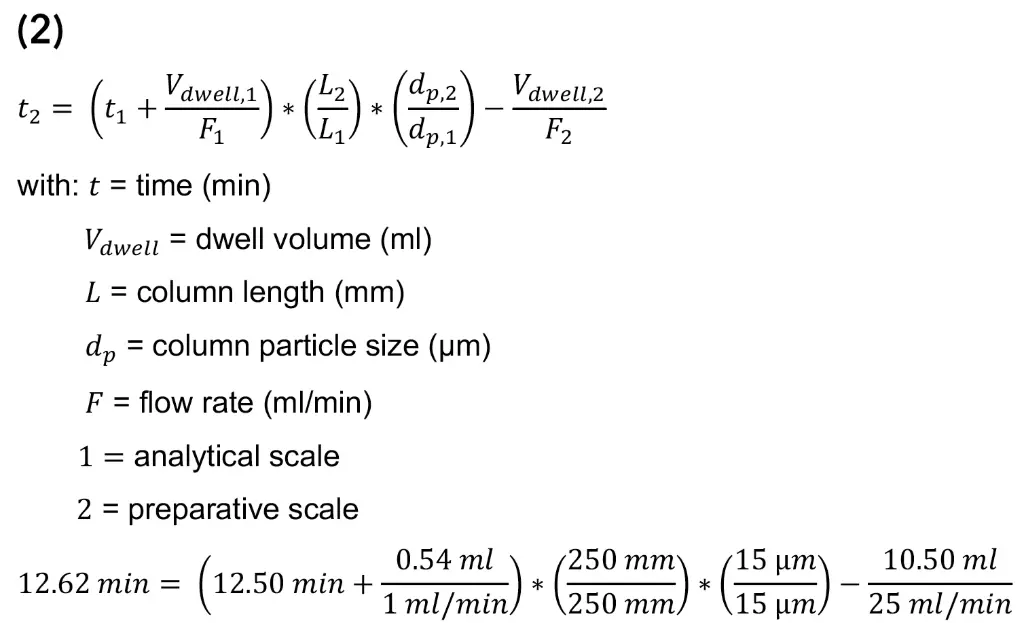
Based on the results, the gradient steps were extended by 12 s. With the obtained method from the scale-up, a measurement was carried out on the preparative system. Since no 250 µl loop was available, the measurement was done with a 200 µl loop. In Fig. 11, both chromatograms before (analytical system) and after the scale-up (preparative system) are shown. In the figure, a slight shift in the retention time of the CBD peak can be seen, which is due to the different pump deliveries, and a slightly lower signal intensity can be seen as a result of the reduced injection volume. Overall, similar chromatographic results were obtained highlighting the successful linear upscale from analytical to preparative scale.

Fig. 11 Scale up. Sample: CBD-rich extract sample; gold: analytical scale; ES II 100-15 C18 250 x 4 mm; 1 ml/min; 10 µl injection; green: preparative scale, preparative UV flow cell; ES II 100-15 C18 250 x 20 mm; 25 ml/min; 200 µl injection.
Conclusion
This application note describes a practical approach to develop and optimize the scale-up process for reversed phase chromatography from an analytical HPLC system to a preparative batch system. It involves using a gradient screening and overload studies before scaling up to preparative dimensions to increase the sample load on the preparative column in order to increase the product yield. For all scale-up procedures, a correct method transfer is required in order to keep the resolution constant. This ensures the highest level of purity and yield from the valuable sample. In this work a scale-up from a column with a 4 mm inner diameter on a HPLC system to a preparative batch system with a 20 mm inner diameter column was successfully developed. The results demonstrate the simplicity of a linear scale-up and the advantages of method optimization in analytical scale. This approach saves time, sample and solvent. The second part of the application note (VPH0081) presents the subsequent establishment of the batch process for the purification of CBD from the CBD-rich cannabis extract.
Material and Methods
Tab. 2 Method parameters overview gradient.
Tab. 3 Method parameter focus gradient.

Tab. 4 Dwell volume for both systems.

Tab. 5 Method parameters of the final method in analytical scale.

Tab. 6 Method parameters preparative system after the scale-up.

Tab. 7 Analytical system configuration.
Instrument | Description | Article No. |
Eluent tray | AZURA E 2.1L | |
Pump | AZURA P 6.1L HPG, 10 ml pump head | |
Detector | AZURA DAD 2.1 L | |
Flow cell | Analytical UV Flow cell, 10 mm path length, 1/16", 10 μl volume, 300 bar, biocompatible Semi-preparative UV Flow cell, 3 mm path length, 1/16", 2 μl volume, 300 bar, sst | |
Autosampler | AZURA AS 6.1L, 700 bar | |
Thermostat | AZURA CT 2.1 | |
Columns | Eurospher II 100-3 C18P 150 x 4,6 mm with integrated precolumn | |
Eurospher II 100-5 C18 150 x 4 mm | ||
Eurospher II 100-5 C18 250 x 4 mm | ||
Eurospher II 100-15 C18 250 x 4 mm | 25DE181E2Q | |
Capillary | 1/16", 0.18 mm, sst | |
Software | ClarityChrom® 9.0.0 | |
ClarityChrom® 9.0.0 PDA extension |

Fig. 12 System setup of analytical HPLC system; left from top to bottom: eluent tray with bottles, pump, detector, autosampler; right: column thermostat with column.
Tab. 8 Preparative system configuration.
Instrument | Description | Article No. |
Eluent tray | AZURA E 2.1L | |
Assistent | AZURA ASM 2.2L | |
Left module: UVD 2.1S | ||
Middle module: valve drive VU 4.1 | ||
Right module: P 4.1S | ||
Flow cell | Semi-preparative UV Flow cell, 3 mm path length, 1/16", 2 μl volume, 300 bar, sst | |
Injection valve | 4-position valve, 8 ports, sst, 1/16" | |
Sample pump | 10 ml pump head, sst | |
Pump | AZURA P2.1L, 250 ml pump head, sst | |
Ternary LPG module | AZURA LPG ternary module for pump P2.1L | AZZ00AB |
Column | Eurospher II 100-15 C18 250 x 20 mm | |
Capillary | 1/16", 0.45 mm, sst | |
Fraction collector | For 1/16" or 1/8" | |
Dynamic mixer | Preparative HPLC, 1/8", 5.9 ml mixing volume, 250 V, 250 bar, titanium | |
Software | Purity Chrom® 6 |
Fig. 13 System setup of preparative HPLC system; left: fraction collector; middle: mixer; right from top to bottom: eluent tray with bottles, assistant module with column holder and column, pump.
References
[1] Blanc CL et al. Purification of organic acids by chromatography: Adsorption isotherms and impact of elution flow rate. Separation and Purification Technology. 141. 2015.
[2] Pertwee RG. Handbook of Cannabis. Oxford University Press. First edition. 2014.
[3] Aizpurua-Olaizola O et al. Evolution of the Cannabinoid and Terpene Content during the Growth of Cannabis sativa Plants from Different Chemotypes. Journal of Natural Products. 79. 2016.
[4] Turner CE et al. Constituents of Cannabis sativa L. XVII. A Review of the Natural Constituents. Journal of Natural Products. 43. 1980.
[5] Hazekamp A. The Trouble with CBD Oil. Medical Cannabis and Cannabinoids. 1. 2018.
[6] Perez E et al. In Vitro and Clinical Evaluation of Cannabigerol (CBG) Produced via Yeast Biosynthesis: A Cannabinoid with a Broad Range of Anti-Inflammatory and Skin Health-Boosting Properties. Molecules. 27. 2022.
[7] ElSohly MA. Marijuana and the Cannabinoids. Humana Press. 2007.
[8] Focused Gradient Calculator. Waters Corporation. 2019. https://www.waters.com/webassets/other/lp/prep_calc/AnalyticaltoPrep/NewPrepcalculator.htm?srsltid=AfmBOoryGrHpsiwnDVEy5mLtXNDvPdxUJQ9anYyvdxp7ZBXp6jIPqMrF
[9] Penduff P. Analytical to Preparative HPLC Method Transfer. Agilent Technologies. 2013.
Application details
Method | Preparative HPLC |
Mode | RP |
Substances | Cannabidiol (CBD), Cannabichromene (CBC), Tetrahydrocannabinol (THC) |
CAS number | 13956-29-1, 20675-51-8, 1972-08-3 |
Version | Application No.: VPH0080 | Version 1 07/2024 | ©KNAUER Wissenschaftliche Geräte GmbH |