Science with Passion
Development of an SMB process for the purification of CBD from a CBD-rich cannabis extract
J. Wesolowski, Y. Krauke, G. Greco; krauke@knauer.net
KNAUER Wissenschaftliche Geräte GmbH, Hegauer Weg 38, 14163 Berlin

Foto: Adobe Stock
Summary
The purification of natural products can be achieved by various techniques, including single- and multi-column liquid chromatography. However, the development of efficient, fast and cost-effective methods for the purification of natural products from samples such as natural extracts remains a difficult and challenging task due to the complexity of the matrix. In contrast to conventional purification methods such as distillation, preparative chromatography uses less energy, consumes less water and chemicals while achieving higher yields[1]. In this application, a SMB (Simulated Moving Bed) process for the purification of CBD (cannabidiol) from a CBD-rich cannabis extract was established. First, a sample preparation was carried out, followed by preliminary tests on the analytical system to design the starting parameters for the SMB process. Subsequently, different separation runs were tested on the SMB system to determine the optimal separation parameters. The SMB process enabled the purification of approximately 2 g CBD/day with a recovery of 81 % and purity of 93 %.
Introduction
The increasing usage of liquid chromatography for purification of compounds from natural sources has resulted in the development of continuous purification processes such as SMB chromatography. This process can achieve higher productivity with better purity and less solvent consumption when compared to conventional batch processes. The SMB process was first developed in 1961 by Broughton and Gerhold through the coupling of chromatographic columns[2]. Originally, the process was designed for several large-scale separations that were particularly difficult to perform using conventional techniques in the petrochemical and sugar industries[2]. Today, SMB chromatography is increasingly used as a separation technique in the pharmaceutical industry and in the production of fine chemicals3. Depending on the economics of the separations, SMB chromatography can offer several advantages over conventional batch chromatography. For example, continuous circulation operation can save eluent and increase productivity[3]. The SMB process was developed from the theoretical concept of true moving bed chromatography[4]. This simulates a continuous countercurrent movement of the solid phase to the mobile phase, which makes it possible to separate mixtures of substances continuously and extract them into two fractions[4].
Here, SMB was used to purify CBD from a CBD – rich cannabis extract in RP mode using ethanol / water mixture as solvent.
Sample Preparation
As reference standards, cannabinoid solutions (1 mg/ml in MeOH, Sigma-Aldrich) were diluted in ethanol to indicated concentrations. The sample was an ethanolic extract from CBD rich cannabis. Before injection, the extract sample was filtered with a PTFE filter (0.20 µm).
Results
Sample preparation
Analysis of the cannabis extract showed that the several unknown compounds such as phytochemicals eluted after the cannabinoids (Fig. 2, blue chromatogram). These late eluting compounds would make the SMB process significantly longer, therefore a pre-preparative chromatographic step was performed to purify the earlier eluting cannabinoids in one fraction. The phytochemicals eluting after the cannabinoid peak were removed from the matrix (Fig. 1). The cannabinoid fraction (F1) was collected from a separation run using 100 % ethanol as solvent. This purification was repeated several times to optain sufficient cannabinoid sample for the later SMB process.
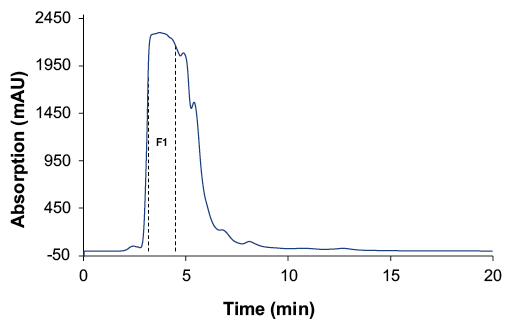
Fig. 1 Preparative fractionation of the cannabinoid peak (F1); wavelenght: 228 nm measured with ES II 100-10 C18 150 x 50 mm; 10 ml, 60 ml/min.
After the pre-preparative purification, the sample was diluted by approx. 1:8 (Tab. 1). Pooled fractions of several preparative runs were concentrated by half of the volume using a rotary evaporator (97 mbar, 50 °C). The samples were analysed using the previously described acetonitrile method[5]. The chromatogram of the analysis showed that after the preparative step, the phytochemicals after the CBC peak were successfully removed (Fig. 2). The measured concentrations of CBD, CBC and ∆9-THC are shown in Tab. 1.
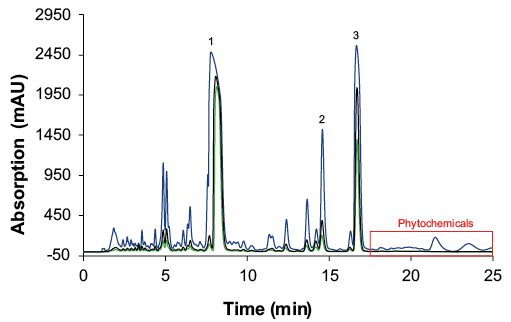
Fig. 2 Overlay chromatograms of the individual cannabis samples. 1: CBD; 2: ∆9-THC; 3: CBC. blue: untreated sample; green: sample after preparative purification; black: sample after evaporation.
Tab. 1 Concentrations of CBD, ∆9-THC and CBC in the different samples.
Substance | CSample | CSample after prep | CEvaporated by half I |
CBD | 35.92 | 4.31 | 8.34 |
∆9-THC | 1.19 | 0.14 | 0.26 |
CBC | 3.29 | 0.39 | 0.80 |
The results from Tab. 1 show that the concentrations of the sample after the evaporation step were approximately twice as high as after the preparative step. Overall, the removal of phytochemicals reduces elution and switching time, thereby reducing cycle time and saving solvent.
Measurements for determination of SMB parameters
The special characteristic of the SMB process is that several identical columns simulate one large column. Therefore, all used columns must ideally show identical separation behaviour. A set of nine columns was tested, from which eight would be used in the SMB system and the nineth for SMB parameter determination in an analytical system. To test the uniformity, the separating behaviour and performance of all columns, the retention time and efficiency of a weak (CBD) and strong (CBC) interacting substance with the stationary phase were measured using an HPLC system. The mean value, maximum and minimum of the retention times and efficiencies for CBD and CBC were calculated (Tab. 2).
Tab. 2 Retention time, efficiency and calculated maximum and minimum values for CBD and CBC.
Column | Retention time CBD (min) | Efficiency CBD (t.p./m) | Retention time CBC (min) | Efficiency CBC (t.p./m) |
#1 | 4.357 | 4487 | 8.841 | 5076 |
#2 | 4.357 | 4438 | 8.851 | 4849 |
#3 | 4.390 | 4693 | 8.920 | 5166 |
#4 | 4.379 | 4519 | 8.909 | 5010 |
#5 | 4.343 | 4748 | 8.795 | 5245 |
#6 | 4.329 | 4563 | 8.753 | 5038 |
#7 | 4.316 | 4561 | 8.717 | 5063 |
#8 | 4.340 | 4664 | 8.761 | 5130 |
#9 | 4.323 | 4601 | 8.730 | 5079 |
Maximum | 4.390 | 4748 | 8.920 | 5245 |
Minimum | 4.316 | 4438 | 8.717 | 4849 |
Average | 4.371 | 4534 | 8.880 | 5025 |
The Column #7 shows the most significant retention time deviation. The deviation is 1.26 % for CBD and 1.84 % for CBC. Based on the results, the columns #1, #2, #3, #4, #5, #6, #8 and #9 were used for the SMB process.
After comparing the performance of the semi-preparative columns, a volume overload study was performed with the pre-purified cannabis sample to determine the maximum column loading without loss of the linear absorption behaviour (Fig. 3). Up to an injection volume of 100 µl the peaks showed a nearly linear absorption behaviour. From the chromatograms of the measurement with 20 µl injection volume, the retention times were 4.27 min for CBD and 7.32 min for ∆9-THC (Fig. 3).
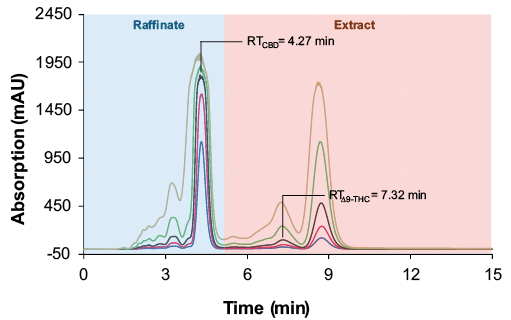
Fig. 3 Overload study in analytical scale. Sample: purified and evaporated CBD-rich cannabis extract; injection volumes blue: 5 µl; red: 10 µl, black: 20 µl; green: 50 µl; yellow: 100 µl; wavelenght: 228 nm measured with ES II 100-15 C18 250 x 8 mm; 4 ml/min.
In addition to the retention times of the raffinate and extract, the tube delay time and void time of the semi-preparative column are required to calculate the SMB method parameters. For this purpose, measurements were carried out with the dead time marker uracil (Fig. 4). The chromatograms showed a tube delay time (without column) of 0.04 min and a void time (with column) of 1.84 min.
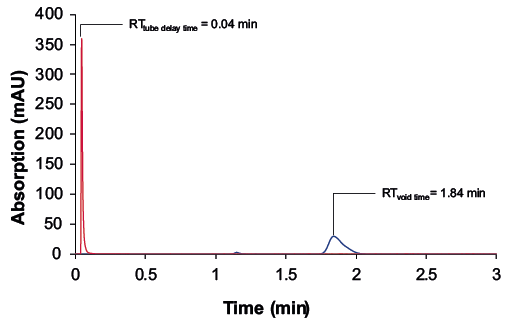
Fig. 4 Chromatograms with the dead time marker uracil (100 µg/mL); wavelength: 228 nm measured with ES II 100-15 C18 250 x 8 mm; 5 µl, 4 ml/min.
Establishment of SMB parameters
Using the retention times from the preliminary tests (Tab. 3), the column dimension and the flow rate, the SMB start parameters were determined using the SMB calculator of the Purity MCC software. The analytes to the stationary phase showed a linear adsorption behavior in the volume overload study (Fig. 3), allowing the application of the triangle theory. The results from the calculator are shown in Fig. 5.
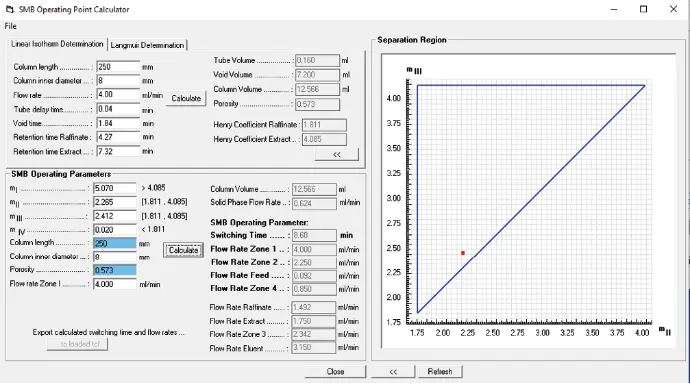
Fig. 5 Screenshot of the Purity MCC - SMB calculator with the SMB start parameters and the separation triangle for linear isotherms.
Tab. 3 Retention times for the design of the SMB parameters.
Substance | Retention time |
CBD | 4.27 min |
∆9-THC | 7.32 min |
Uracil without column (tube delay time) | 0.04 min |
Uracil with column (void time) | 1.84 min |
The Henry coefficients of the raffinate and extract were determined using the column parameters and the retention times of the CBD (extract) and ∆9-THC (raffinate). The porosity of the stationary phase was calculated from the tube delay and void time. The total cylindrical volume of the column was calculated using the column dimension. The tube and void volume were also determined. The parameter ranges for the four zones were determined by applying the triangle theory.
Based on experience, the operating point was chosen in the lower left corner of the triangle (Fig. 5, red dot). Due to the impurities before the CBD peak (Fig. 3), the mIV value was chosen to be as small as possible to ensure the regeneration of the mobile phase. To ensure the regeneration of the stationary phase due to the late eluting CBC peak (Fig. 3), the mI value was set high to elongate the switching time. The flow rates for each zone were calculated from the selection of the m values. The flow rate of zone 1 was set to 4 ml/min by the previous tests. The switch time of the SMB process was calculated using the solid movement of the stationary phase, the porosity and the column volume.
First SMB runs and method optimization
For the first SMB run (method 1, MO1), the SMB parameters defined in Fig. 5 were used as starting conditions.
An open loop set-up was used for the first runs. In this configuration, the solvent is not recycled from zone 4 to zone 1 but diverted into a waste outlet. The raffinate, extract and waste stream were collected, either over one switch or a whole cycle for analysis by analytical HPLC. To evaluate the SMB process, the resulting samples were analysed using a short process control method and for quantification the previously described acetonitrile method[5]. The process control method was run on a column with a smaller inner diameter (ES II 100-15 C18 250 x 4 mm), at 1 ml/min and 10 µl injection volume. Fig. 6 (raffinate) and Fig. 7 (extract) show an overlay of chromatograms of the sample measurements from the initial 23 cycles (cycle 1 to 23). This method allowed a fast evaluation of the separation results.
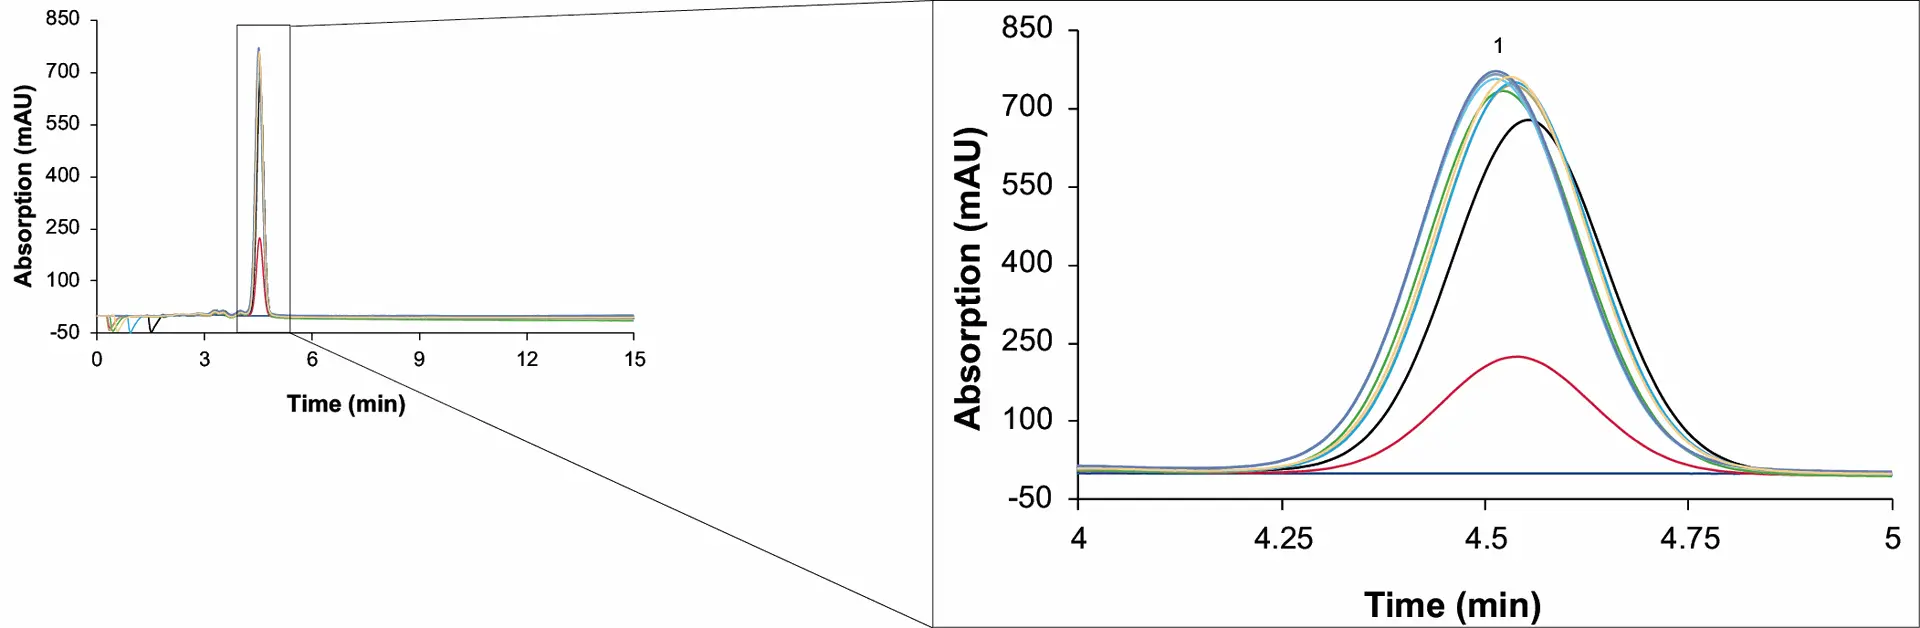
Fig. 6 Chromatograms of the raffinate samples from the first 23 cycles. 1: CBD. MO1; dark blue: cycle 1; red: cycle 2; black: cycle 3; green: cycle 4; gold: cycle 5; light blue: cycle 6; turquoise: cycle 7; grey: cycle 8 to 21; purple: cycle 22; brown: cycle 23; wavelenght: 228 nm measured with ES II 100-15 C18 250 x 4 mm; 10 µl; 1 ml/min.
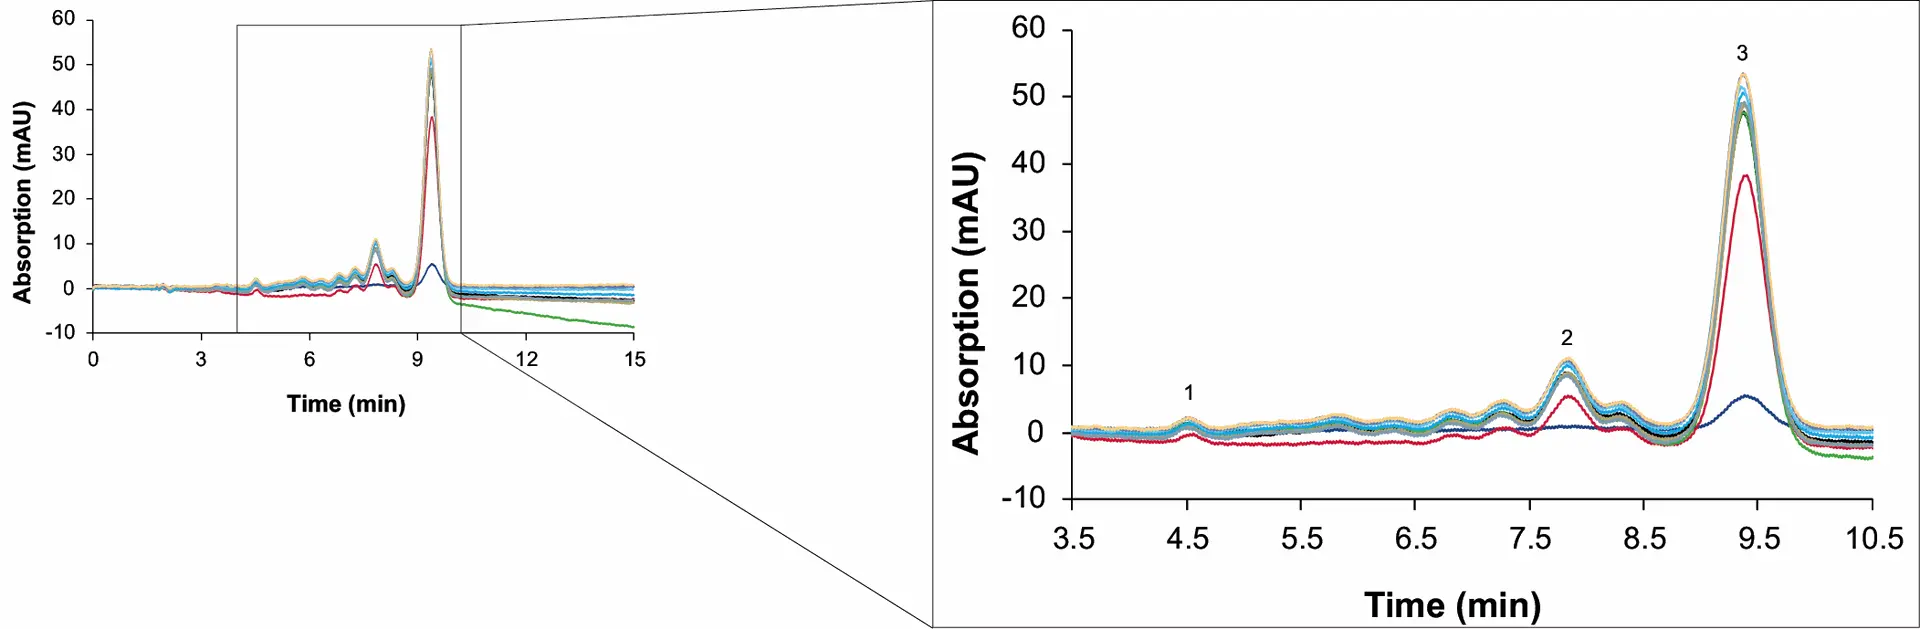
Fig. 7 Chromatograms of the extract samples from the first 23 cycles. 1: CBD, 2: ∆9-THC, 3: CBC. MO1; dark blue: cycle 1; red: cycle 2; black: cycle 3; green: cycle 4; gold: cycle 5; light blue: cycle 6; turquoise: cycle 7; grey: cycle 8 to 21; purple: cycle 22; brown: cycle 23; wavelenght: 228 nm measured with ES II 100-15 C18 250 x 4 mm; 10 µl; 1 ml/min.
The concentration, recovery and purity of CBD in the raffinate were determined in the first 23 cycles using the acetonitrile method. The results are shown in Tab. 4.
Tab. 4 The concentration, recovery and purity of CBD in the raffinate over the first 23 cycles.
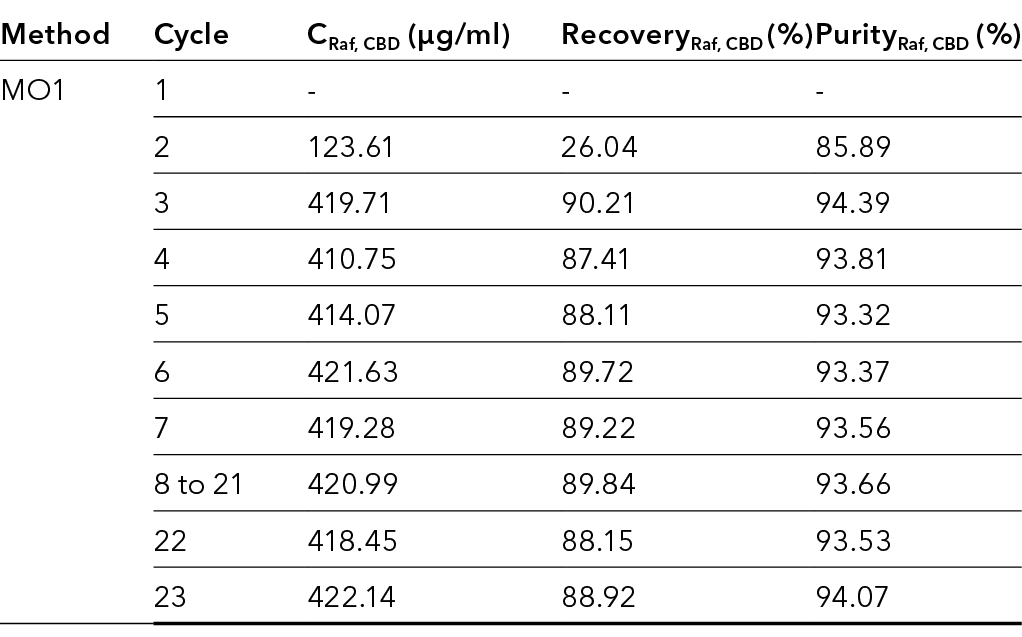
The measurements showed that the concentration of CBD in the raffinate increased with increasing number of cycles. Between the third and fourth cycle, only minimal deviations in the concentrations were observed. Subsequently, the process was in a steady state after 3 to 4 cycles. In addition to the concentration, the recovery and purity of the CBD also increased with increasing cycle numbers.
Two UV detectors were installed in front of the extract and raffinate outlets as an additional process control tool. The UV signals can show if a process is running stable or if it collapses. Also, it will show when a steady state of the process is reached (Fig. 8 and Fig. 9).
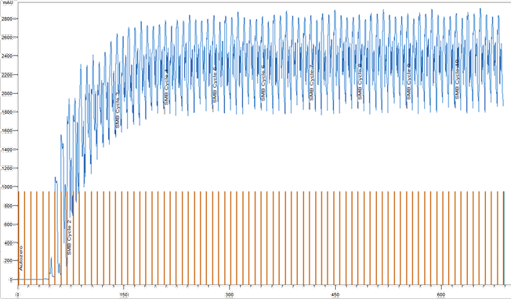
Fig. 8 UV signal at the raffinate output over cycles 1 to 10. MO2.
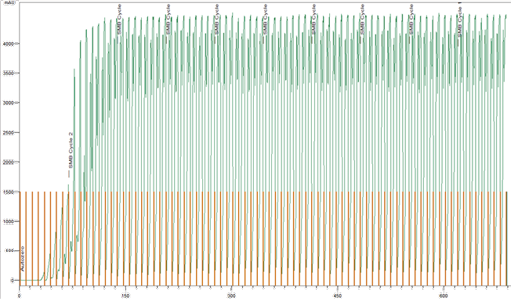
Fig. 9 UV signal at the extract output over cycles 1 to 10. MO2.
The UV signal at the raffinate and extract outlet confirm the results in Tab. 4 and clearly showed that the concentrations of cannabinoids in the outlets increased with number of cycle. After cycle 3, the process approached the steady state. From the third to the fourth cycle, there were only minimal signal variations.
The chromatograms of the three outlets after 23 cycles and the sample are shown in Fig. 10. The comparison showed that CBD was only found in the raffinate as desired and CBC together with ∆9-THC were found in the extract.
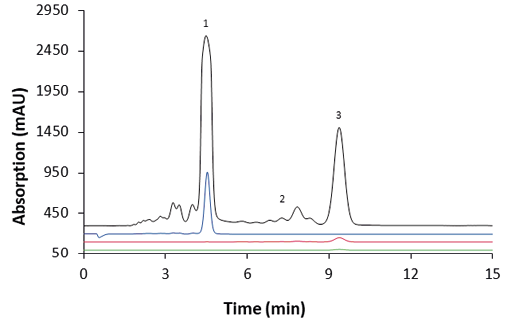
Fig. 10 Chromatograms of the three outlets for cycle 23 and the sample. 1: CBD, 2: ∆9-THC, 3: CBC. MO1; black: sample; blue: raffinate; red: extract; green: waste; wavelenght: 228 nm measured with ES II 100-15 C18 250 x 4 mm; 10 µl; 1 ml/min.
As expected, a dilution of the collected extract, raffinate and waste was observed compared to the sample. The recoveries for CBD, CBC and ∆9-THC in the respective outlets for cycle 23 are shown in Tab. 5. ∆9-THC , CBC and an unquantifiable amount of CBD were detectable in the extract. A small amount of CBD and CBC was also found in the waste. The raffinate contained only CBD.
Tab. 5 Recoveries for CBD, CBC and ∆9-THC in the different outlets for cycle 23. *Qualifiable but not quantifiable. MO1.
Outlet | RecoveryCBD | Recovery∆9-THC | RecoveryCBC |
Raffinate | 89 % | 0 % | 0 % |
Extract | * | 81 % | 80 % |
Waste | 0.1 % | 0 % | 7 % |
The fact that CBC was found in the waste indicates that the switching time was too short to elute all late eluting compounds from the columns before switching from zone 1 to zone 4. The columns with the CBC were moved to zone 4, where the CBC was transported with the flow into the waste. Therefore, the switching time was increased from 8.51 min to 8.60 min (+ 0.09 min). The flow rate in zone 2 was also raised from 2.202 ml/min to 2.250 ml/min (+ 0.048 ml/min) to transfer the remaining CBD, which was quantifiable in the extract, into the raffinate. Analysis of the outlets showed that the flow was too low, the CBD was carried forward with the columns. Cycles 24 to 43 were collected and analysed to evaluate the parameter changes. The recoveries for CBD, CBC and ∆9-THC in the different outlets after 43 cycles are shown in Tab. 6. The results showed that the CBD was still separated from the substance mixture and was found in the raffinate. No CBD was found in the waste, but CBC was still present. CBD was also found in the extract in an unquantifiable amount.
Tab. 6 Recoveries for CBD, CBC and ∆9-THC in the different outlets for cycle 43. *Qualifiable but not quantifiable. MO2.
Outlet | RecoveryCBD | Recovery∆9-THC | RecoveryCBC |
Raffinate | 90 % (+ 1 %) | 0 % | 0 % |
Extract | * | 81 % | 84 % (+ 4 %) |
Waste | 0 % (- 0.1 %) | 0 % | 3 % (- 4 %) |
As the target substance was CBD, the contamination by the CBC in the waste was not relevant and a small loss of CBD to the extract was accepted. For this reason, the next step was the change to the closed loop configuration to recycle some of the eluent. By working in closed loop, a part of the eluent (zone 4 flow) was continuously re-circulated to the system. The recoveries for CBD, CBC and ∆9-THC in the outputs for cycle 48 are shown in Tab. 7. The results showed that CBD was still separated from the mixture and was found in the raffinate. Furthermore, CBD could be found in the extract in a now quantifiable amount.
Tab. 7 Recoveries for CBD, CBC and ∆9-THC in the different outlets for cycle 48. *Qualifiable but not quantifiable. MO3.
Outlet | RecoveryCBD | Recovery∆9-THC | RecoveryCBC |
Raffinate | 89 % (- 1 %) | 0 % | * |
Extract | 0.8 % (+ 0.8 %) | 80 % (- 1 %) | 84 % |
In the next step, the feed flow was increased from 0.082 ml/min to 0.092 ml/min to enhance the productivity of the process. The recoveries for CBD, CBC and ∆9-THC in the outlets for cycle 65 are shown in Tab. 8.
Tab. 8 Recoveries for CBD, CBC and ∆9-THC in the different outlets for cycle 65. *Qualifiable but not quantifiable. MO4.
Outlet | RecoveryCBD | Recovery∆9-THC | RecoveryCBC |
Raffinate | 87 % (- 2 %) | 0 % | 2 % (+ 2 %) |
Extract | 0.3 % (- 0.5 %) | 80 % (- 1 %) | 83 % (- 1 %) |
A contamination of both outlets was observed therefore the process was stopped at this point. Tab. 9 summarizes the results for all four tested methods. CBD is the target product, therefore only its recovery and purity were determined.
Tab. 9 Results of the SMB process using different methods. *Qualifiable, but not quantifiable.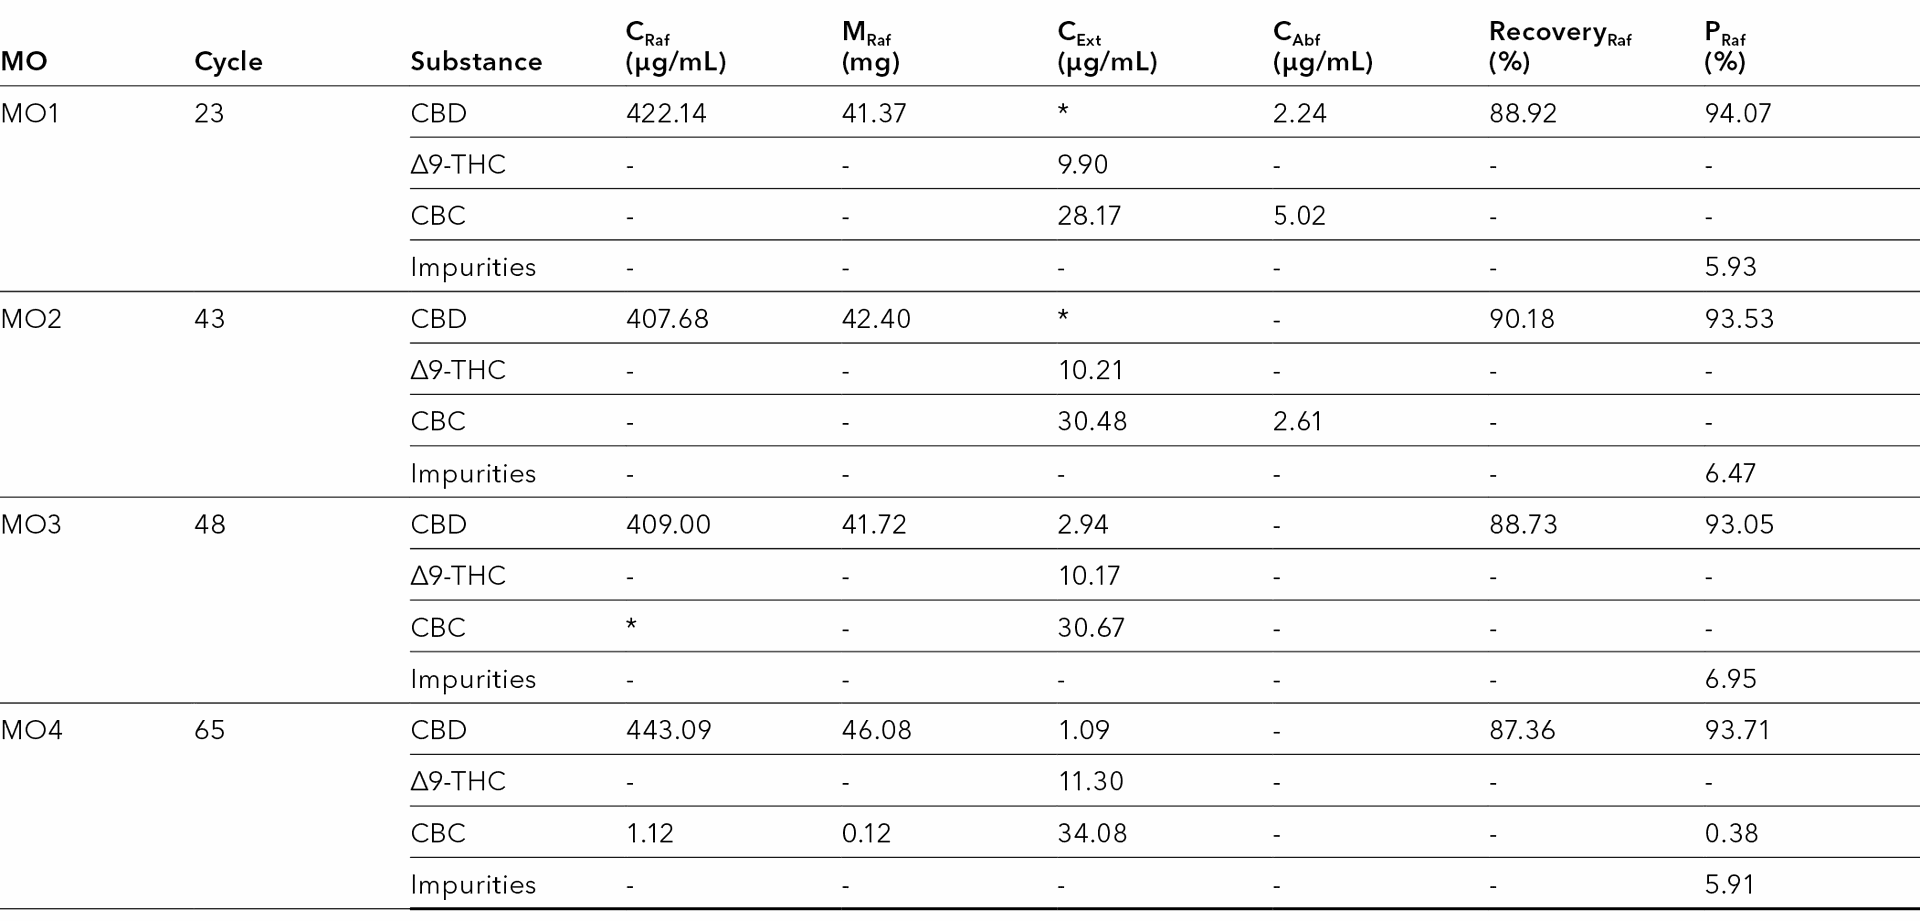
The best results in terms of CBD recovery were achieved with the method MO2. The comparison showed that with the method MO2 the recovery of CBD was about 90 %. Approximately 42 mg of CBD was recovered from the raffinate in each cycle with a purity of approximately 93 % using the method MO2. It should be noted that the MO2 method is an open-loop method, in contrast to the MO3 and MO4 methods, which allow eluent recycling. The separation does not work as good with MO3 and MO4 due to raffinate contamination with CBC. However, if minimal raffinate contamination were to be accepted, the MO4 method would be the better choice.
The aim of a purification process is to keep the obtained amount of target product as high as possible. Therefore, two possibilities existed to optimize the process. The first option was to increase the feed / sample flow and the second option was to use a more concentrated sample. As a higher sample flow resulted in contamination of the raffinate (Tab. 8), a more concentrated sample was used in the next experiments. To be able to work with a more concentrated sample on the SMB, the extract sample was evaporated again by half of its volume and analysed using the acetonitrile method. The results are shown in Tab. 10.
Tab. 10 Concentrations of CBD, ∆9-THC and CBC in the different samples.
Substance | CSample | CSample after prep | CEvaporated by half I | CEvaporated by half II |
CBD | 35.92 | 4.32 | 8.34 | 20.54 |
∆9-THC | 1.19 | 0.14 | 0.26 | 0.56 |
CBC | 3.29 | 0.39 | 0.80 | 1.81 |
Based on the cannabinoid concentrations, after the second evaporation step the sample was concentrated twice as much as after the first evaporation step. Accordingly, the new sample was diluted approximately 1:2. For the subsequent SMB process, the new sample and method MO2 was used. The chromatograms of all outlets for cycle 15 and the sample are shown in Fig. 11.
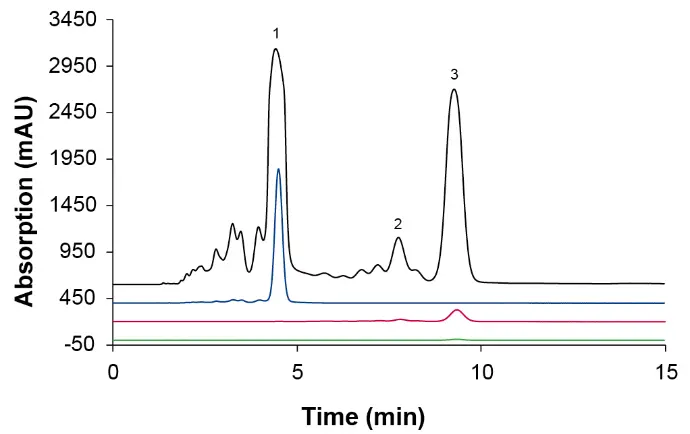
Fig. 11 Chromatograms of the three outlets for cycle 15 and the higher concentrated sample. 1: CBC, 2: ∆9-THC, 3: CBC. MO2; black: sample; blue: raffinate; red: extract; green: waste; wavelenght: 228 nm measured with ES II 100-15 C18 250 x 4 mm; 10 µl; 1 ml/min.
The recoveries for CBD, CBC and ∆9-THC in the different outlets for cycle 15 are shown in Tab. 11. ∆9-THC, CBC and CBD were detectable in the extract. A small amount of CBD and CBC was also found in the waste. In the raffinate only CBD was found.
Tab. 11 Results of the SMB process using method MO2.
Outlet | RecoveryCBD | Recovery∆9-THC | RecoveryCBC |
Raffinate | 80 % | 0 % | 0 % |
Extract | 0.20 % | 84 % | 79 % |
Waste | 0 % | 0 % | 3 % |
Tab 12 Recoveries for CBD, CBC and ∆9-THC in the different outlets for cycle 15. MO2.
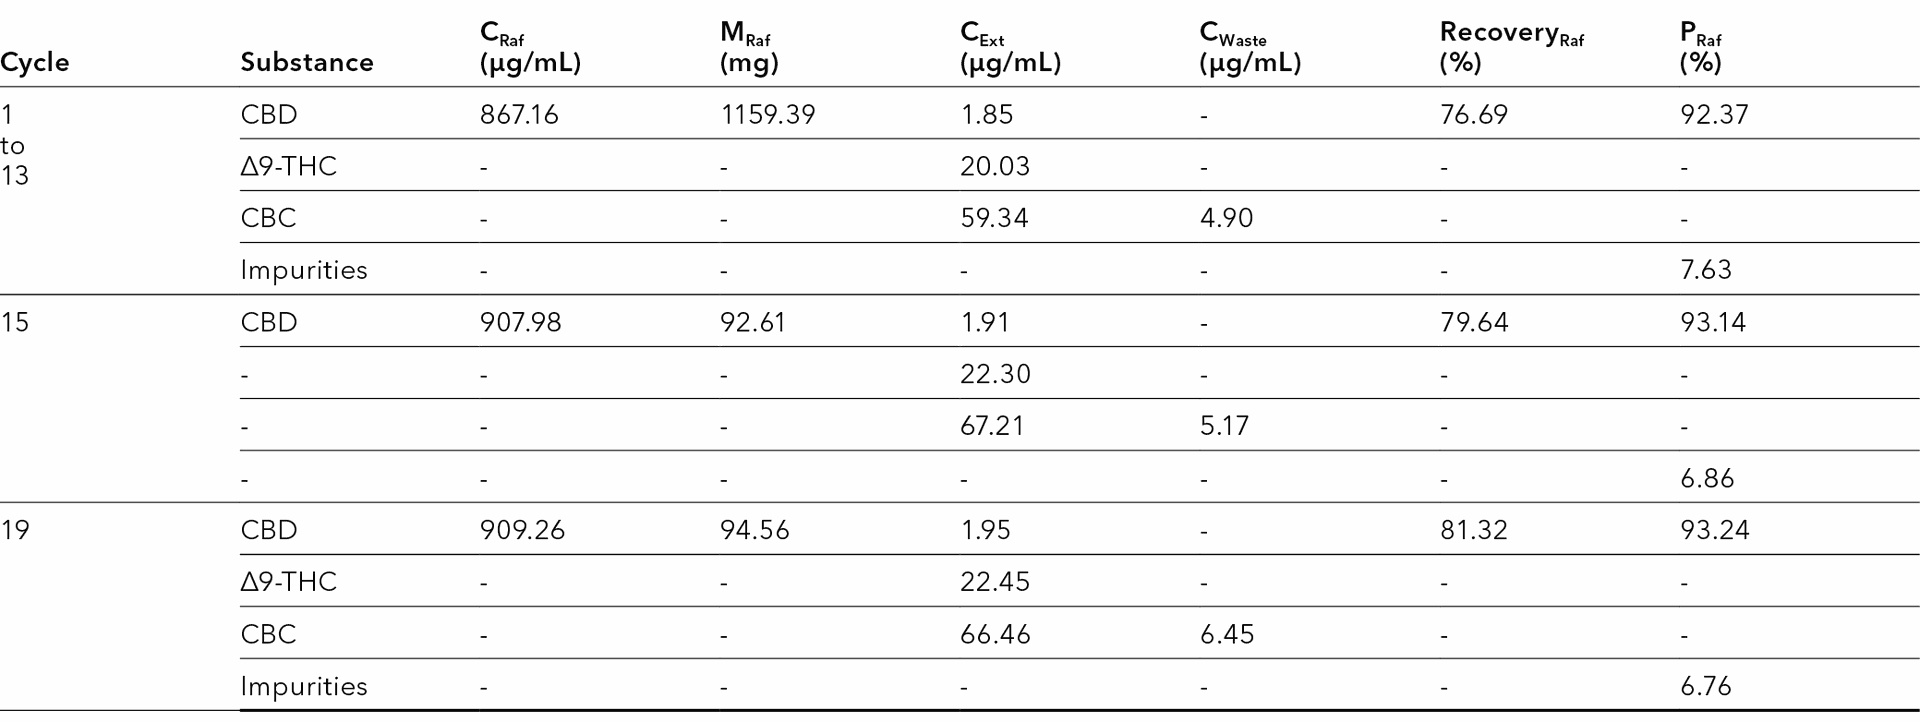
Tab. 12 summarizes the results for selected cycles. CBD was the target product, so only its recovery and purity were considered. The results show that with the method MO2 the recovery of CBD was about 80 %. With cycle 19, approximately 95 mg CBD was recovered from the raffinate with a purity of about 93 %.
Conclusion
An ethanol - based simulated moving bed chromatography method was developed to purify CBD from a CBD-rich extract. The results showed that with the higher concentrated sample, the yield could be doubled from 42 to 95 mg per cycle with the same purity but 10 % lower recovery. Subsequently, approximately 36 mg/h and 878 mg/d could be purified with the half-concentrated extract sample (CCBD = 8.34 mg/ml). In comparison, about 83 mg/h and about 1997 mg/d could be purified with the higher concentrated sample (CCBD = 20.54 mg/ml). The purity of the extract sample was increased from 77 % to 93 %. The results show how a SMB is used to purify high purity target compound from a sample. The shown method is an example and was targeted at one cannabinoid the CBD. Depending on the target, the method can be adapted to other target compounds from different samples.
Material and Methods
Tab. 13 Parameters pre-preparative method.
Parameter | Value |
Column | ES II 100-10 C18 150 x 50 mm |
Flow rate | 60 ml/min |
Data rate | 2 Hz |
Time constant | 500 ms |
Temperature | Ambient |
Injection volume | 10 ml |
Wavelength | 228 nm |
Eluent | EtOH |
Isocratic | 100 % EtOH |
Time | 20 min |
Tab. 14 Parameters analytical method – SMB method development.
Parameter | Value |
Column | ES II 100-15 C18 250 x 8 mm |
Flow rate | 4 ml/min |
Data rate | 10 Hz |
Temperature | 25 °C |
Injection volume | 20 µl |
Wavelength | 228 nm |
Eluent | A: H2O B: EtOH |
Isocratic | 20 % H2O 80 % EtOH |
Time | 15 min |
Tab. 15 Parameters process control method SMB process.
Parameter | Value |
Column | ES II 100-15 C18 250 x 4 mm |
Flow rate | 1 ml/min |
Data rate | 10 Hz |
Temperature | 25 °C |
Injection volume | 10 µl |
Wavelength | 228 nm |
Eluent | A: H2O B: EtOH |
Isocratic | 20 % H2O 80 % EtOH |
Time | 15 min |
Tab. 16 Methods for the SMB process; MO - method.
Parameter | MO1 | MO2 | MO3 | MO4 |
Zone 1 Pump | 4.000 ml/min | 4.000 ml/min | 4.000 ml/min | 4.000 ml/min |
Zone 2 Pump | 2.202 ml/min | 2.250 ml/min | 2.250 ml/min | 2.250 ml/min |
Feed Pump | 0.082 ml/min | 0.082 ml/min | 0.082 ml/min | 0.092 ml/min |
Zone 4 Pump | 0.850 ml/min | 0.850 ml/min | 0.850 ml/min | 0.850 ml/min |
Switching time | 8.51 min | 8.60 min | 8.60 min | 8.60 min |
Cycle time | 68.08 min | 68.80 min | 68.80 min | 68.80 min |
Loop | Open Loop | Open Loop | Closed Loop | Closed Loop |
Mobile phase | EtOH:H2O 80:20 | EtOH:H2O 80:20 | EtOH:H2O 80:20 | EtOH:H2O 80:20 |
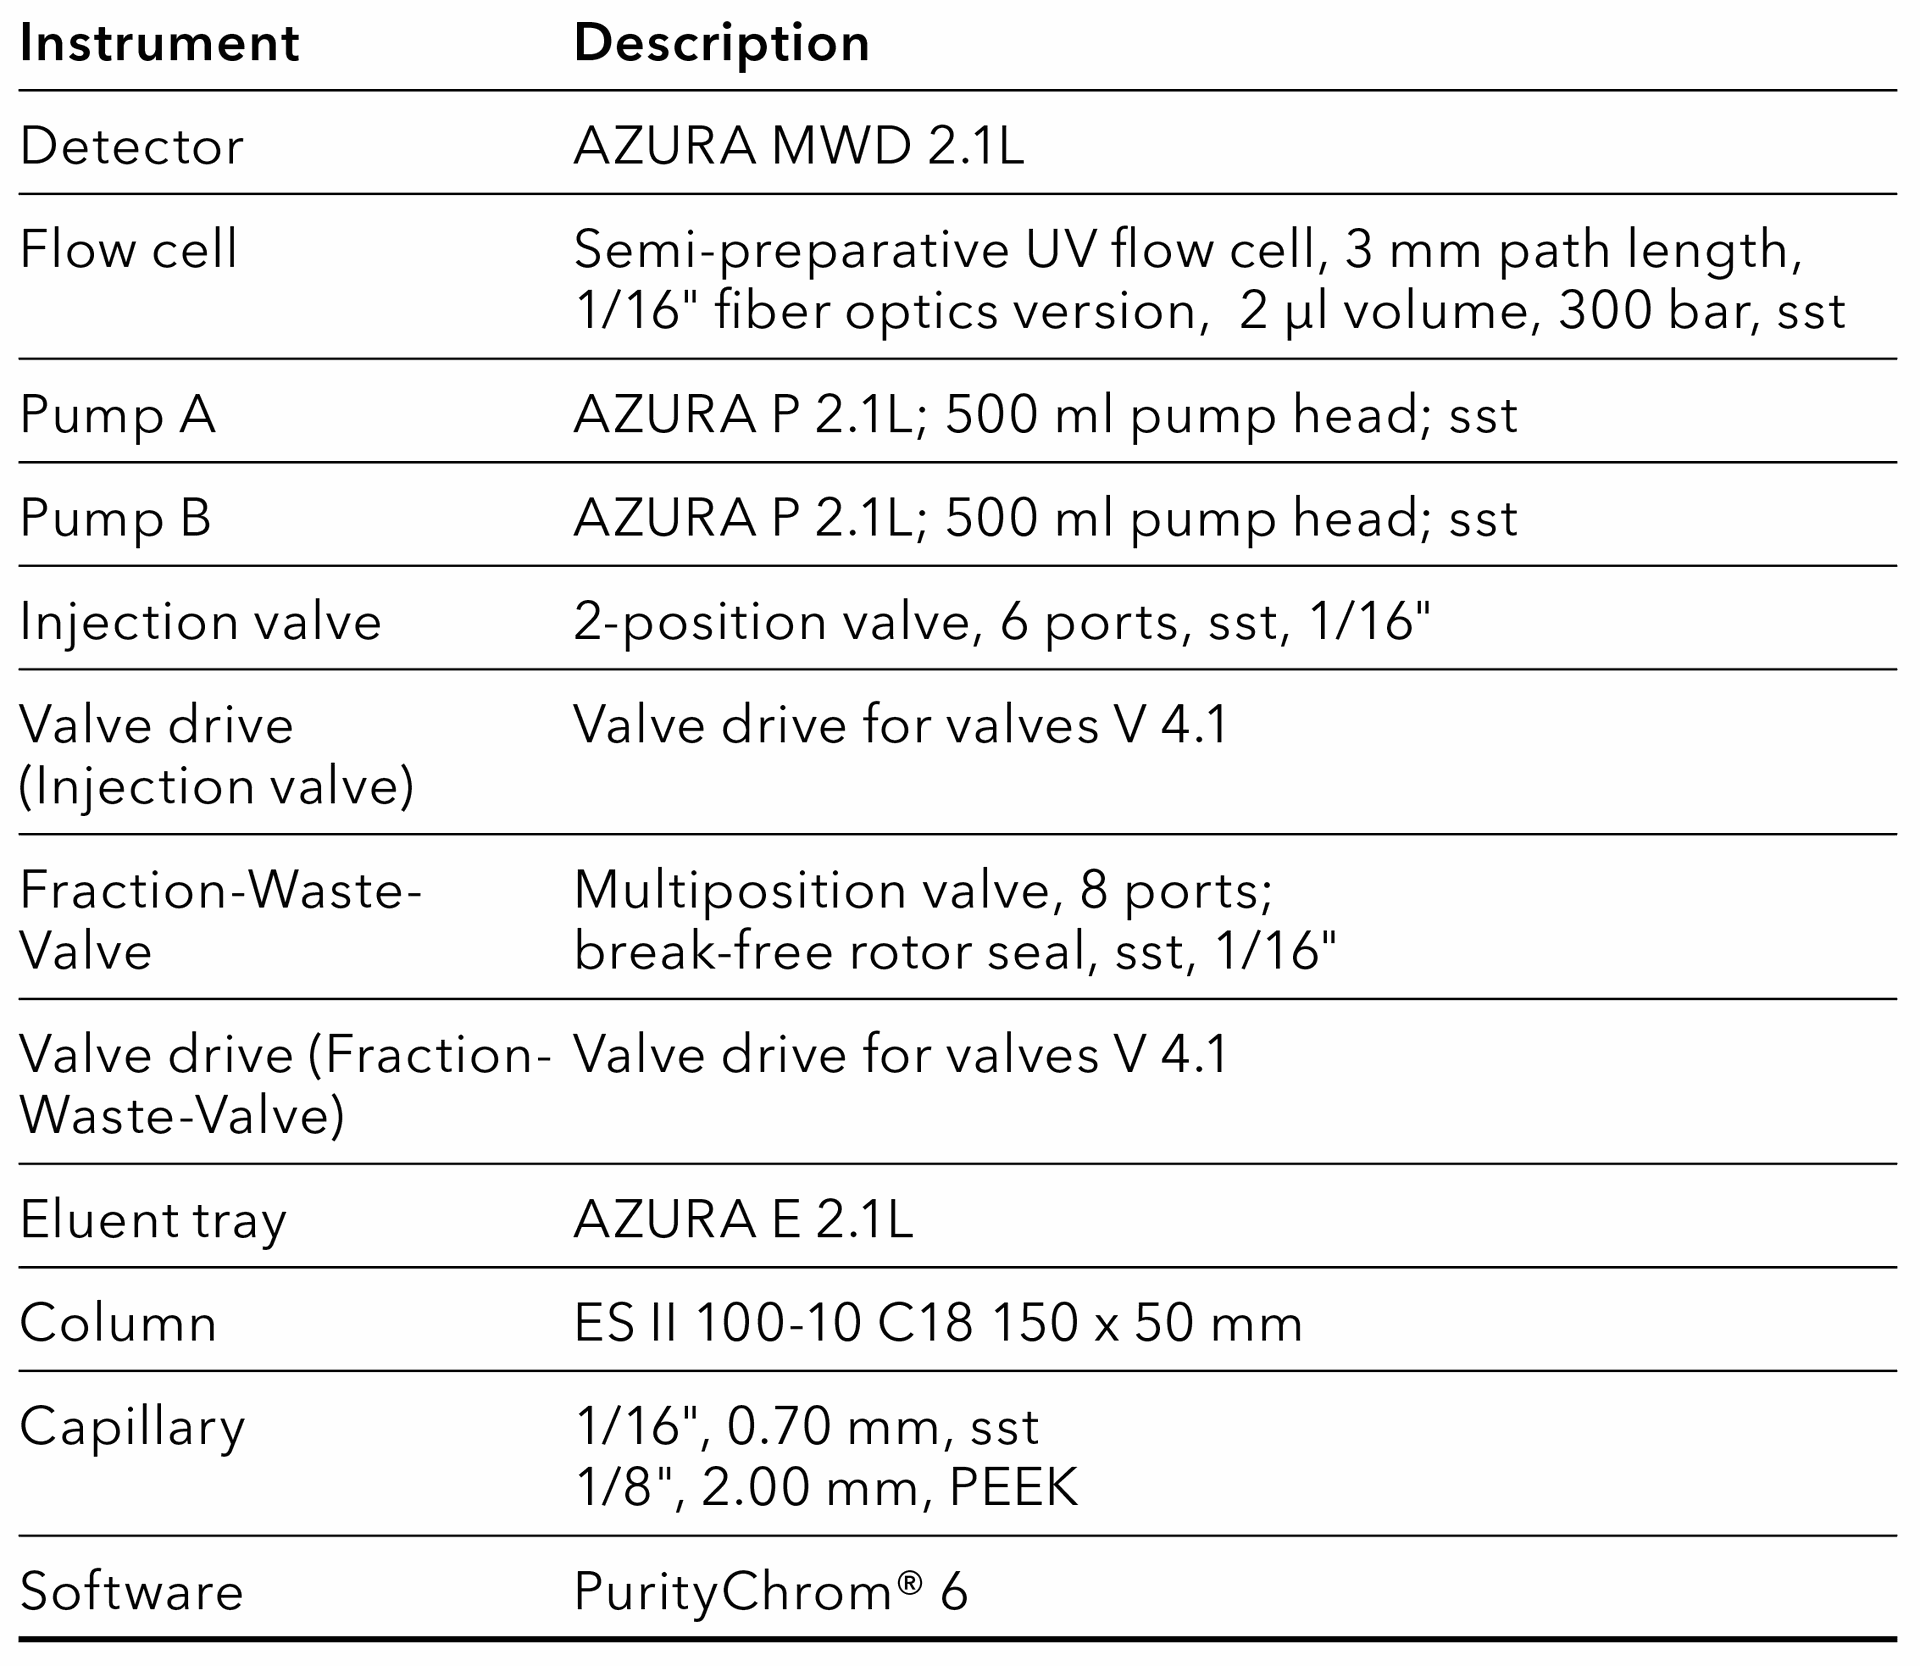
Tab. 17 System configuration preparative HPLC system.
Tab. 18 System configuration SMB.
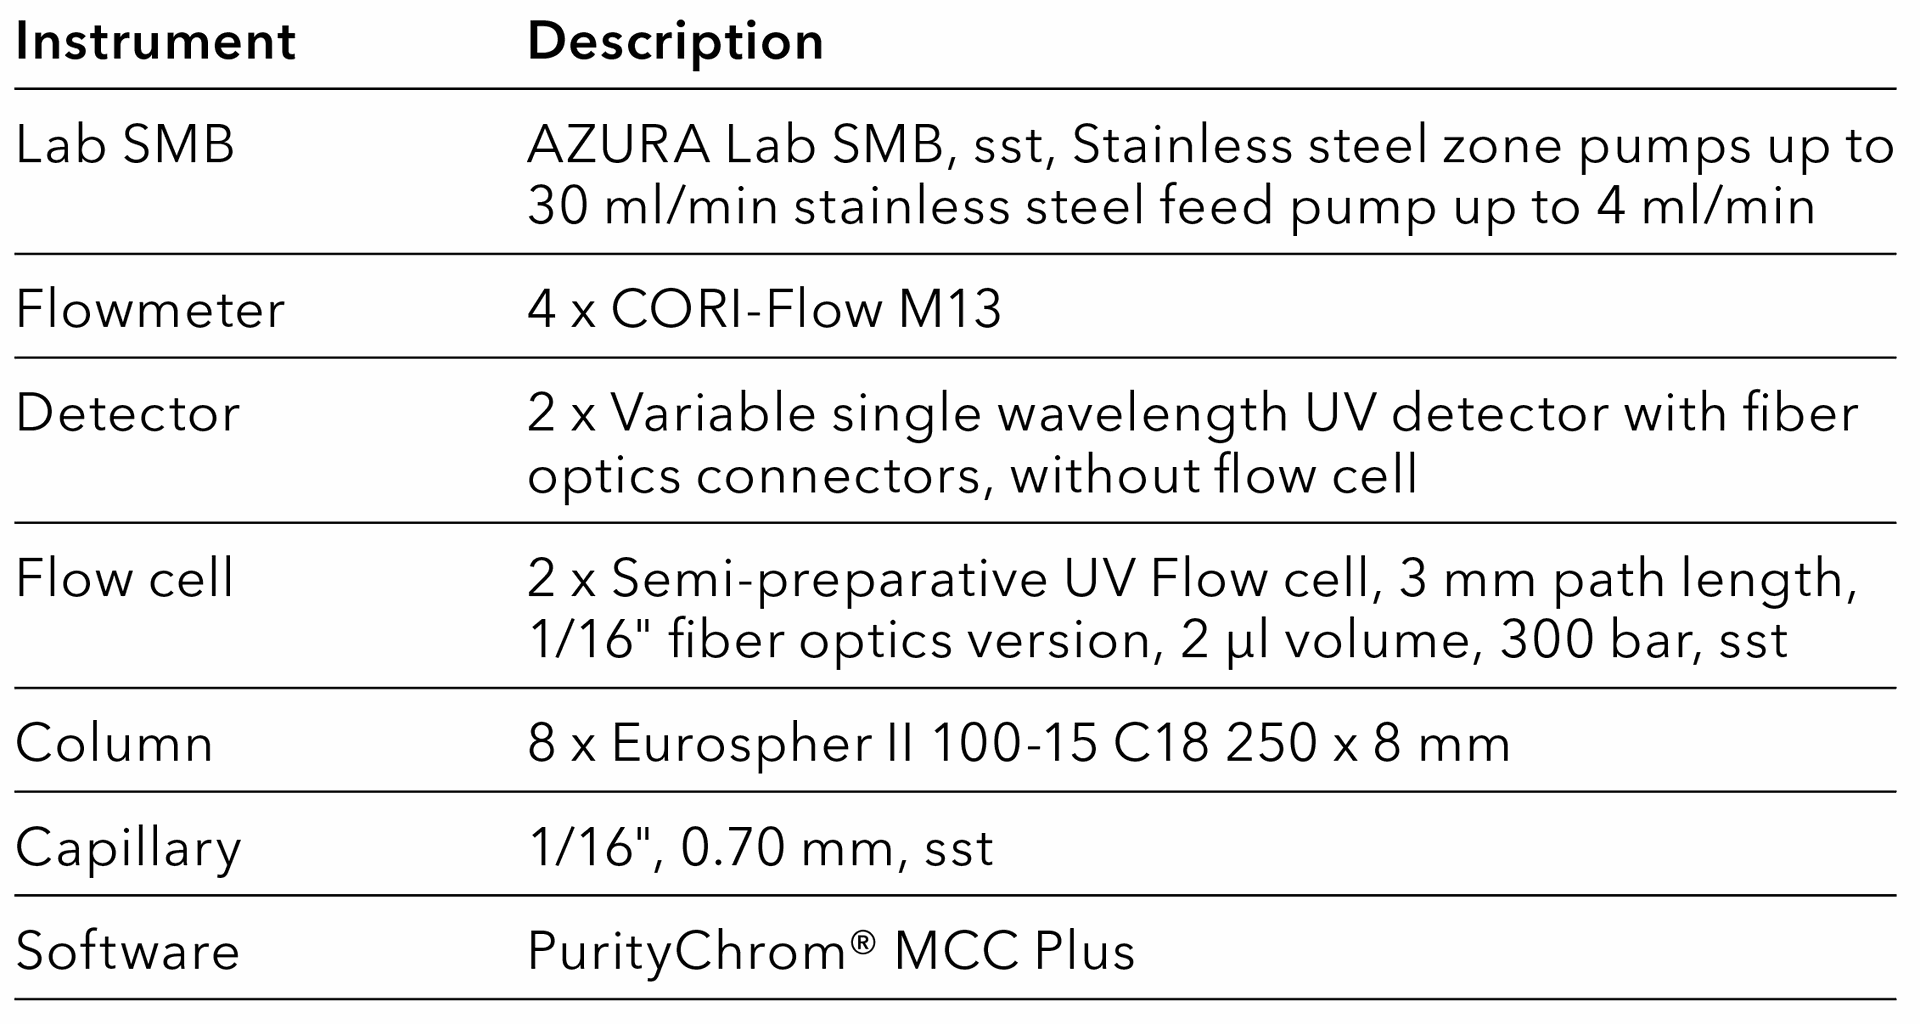
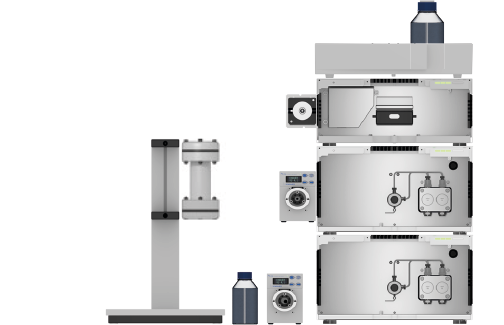
Fig. 12 System setup preparative HPLC system; left: Column holder with column, eluent bottle for fraction collection, valve drive with fraction waste valve; middle from top to bottom: detector, pump A with flow cell, pump B with valve drive and injection valve; right: eluent tray with bottles.
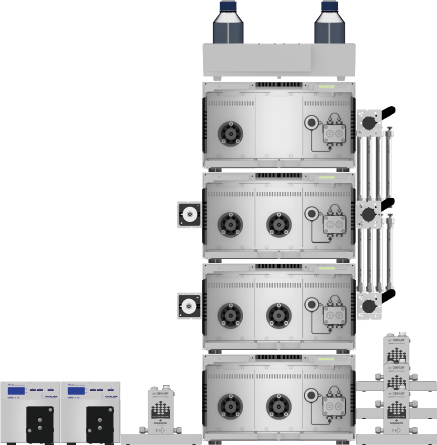
Fig. 13 System setup SMB; left: Detectors, flow meter; middle from top to bottom: Eluent tray with bottles, assistant 1 with manual valve, assistant 2 with measuring cell, manual valve and column holder, assistant 3 with measuring cell and manual valve, assistant 4; right: flow meters.
References
[1] Blanc CL et al. Purification of organic acids by chromatography: Adsorption isotherms and impact of elution flow rate. Separation and Purification Technology. 141. 2015.
[2] Rajendran A et al. Simulated moving bed chromatography for the separation of enantiomers. Journal of Chromatography A. 1216. 2009.
[3] Rodrigues A.E et. al. Simulated Moving Bed Technology: Principles, Design and Process Applications. Butterworth-Heinemann. 2015.
[4] Seidel‐Morgenstern A et al. New Developments in Simulated Moving Bed Chromatography. Chemical Engineering Technology. 31. 2008.
[5] Loxterkamp, L., Monks, K. (C)an(n)alyze: determination of 16 cannabinoids inside flowers, oils and seeds. KNAUER Wissenschaftliche Geräte GmbH (2020) https://www.knauer.net/en/cannalyze-determination-of-16-cannabinoids-inside-flowers-oils-and-seeds/a34489
Application details
Method | SMB |
Mode | RP |
Substances | Cannabidiol (CBD), Cannabichromene (CBC), (−)-trans-Δ9-tetrahydrocannabinol (∆9-THC) |
Key words | SMB, continuous chromatography, preparative chromatography, RP, purification of natural products, method development, separation |
CAS number | 13956-29-1, 20675-51-8, 1972-08-3 |
Version | Application No.: VPH0082 Version 1 / 12/2024 | ©KNAUER Wissenschaftliche Geräte GmbH |
Documents
You can download the application here.
