Science with Passion

Application No.: VFD0192 Version 2 11/2023
Determination of mycotoxins – in cannabis and cannabis derived products with fluorescence detection
J. Kramer, S. Huhmann, G. Greco; kramer@knauer.net
KNAUER Wissenschaftliche Geräte GmbH, Hegauer Weg 38, 14163 Berlin

Photo: pixabay.com
Summary
The quality control of hemp and cannabis before human consumption e.g., the determination of pesticide residues and mycotoxins in cannabis biomass and its derived products, is mandatory. The U.S. Food & Drug Administration (FDA) and COMMISSION REGULATION (EU) 2023/915 set limit values for mycotoxins in human food and animal feed. Organizations like AOAC are developing method requirements for mycotoxin determination in cannabis matrices. AOAC SMPR® 2021.010 defines aflatoxins B1/B2, aflatoxins G1/G2 and ochratoxin A as analytes of interest and specifies limits of quantification and qualification for cannabis biomass and cannabis derived products. Here, we describe four preparation methods and an analytical chromatography LC-FLD method to detect mycotoxins in different hemp matrixes at ppb level.
Introduction
Due to the potential healthcare benefits of cannabis and hemp, the market for this plant and its products has increased dramatically in recent years. In several states cannabis is already legal for medicinal and/or recreational use. Quality control before human consumption e.g., the determination of pesticide residues and mycotoxins in cannabis biomass and its derived products, is therefore mandatory. The number of regulated pesticides varies dependent on state/country/region. The U.S. Food & Drug Administration (FDA) sets a limit value of 20 ppb for mycotoxins in human food and animal feed [1]. Similar but also lower values depending on the matrix are set by COMMISSION REGULATION (EU) 2023/915. [2]. Organizations like AOAC are developing method requirements for mycotoxin determination in cannabis matrices.
AOAC SMPR® 2021.010 defines aflatoxins B1/B2, aflatoxins G1/G2 and ochratoxin A as analytes of interest and specifies limits of quantification and qualification for cannabis biomass and cannabis derived products[3]. The most chosen detector for mycotoxin determination is the mass spectrometer (MS). The regulations are met easily but due to the complexity of an LC-MS system, the operation can be challenging. Therefore, fluorescence detection (FLD) is investigated as an alternative detection method. The results are compared regarding the achievement of valid limit values, consumption of solvents and energy, as well as handling/user-friendliness. Cannabis analysis also includes sample preparation. Four different samples, cannabis/hemp pellets, cannabis/hemp seeds, commercially available hemp flour, and hemp oil were investigated, and four different sample preparation procedures were processed. The following procedures were applied: P1 – solid-liquid extraction/liquid-liquid extraction, P2 – a standard QuEChERS extraction with dispersive cleaning, P3 – extraction with following CrossTOX cleanup and P4 – extraction with following solid phase extraction using immunoaffinity columns (Fig. 1). Results are investigated and evaluated in terms of time, costs per sample, solvent consumption, and achievement of limit values.

Fig. 1 Simplified overview of sample preparation procedures
Sample Preparation
Samples of hemp seeds and hemp pellets were shredded before weighing. Commercially hemp flour and oil were used without further pretreatment. Samples were spiked at two different levels (L4 and L2 of calibration, Tab. 1) for determination of recovery. The used CrossTOX and BEKOlut immunoaffinity SPE columns are specific for the desired mycotoxins but are not officially validated for cannabis/hemp matrices. Six mycotoxins were investigated. Therefore, a mixed standard of aflatoxin B1 (B1), aflatoxin B2 (B2), aflatoxin G1 (G1), aflatoxin G2 (G2), ochratoxin A (OTA) and zearalenone (ZON) was separated.
Solid-liquid extraction (SLE)/liquid-liquid extraction (LLE)
Weigh 1 g of sample into a 50 ml falcon tube. Add 5 ml of acetonitrile. Vortex/shake for 10 minutes. Centrifuge for 10 minutes at 3000 rpm. Filter supernatant with 0.2 µm nylon filter. Transfer 500 µl of filtered extract to an autosampler vial and add 500 µl of acetonitrile.
QuEChERS
Weigh 2 g of sample into a 50 ml falcon tube. Add 10 ml of deionized water. Vortex/shake for 10 minutes. Add 10 ml of acetonitrile. Vortex/shake for 10 minutes. Add QuEChERS extraction salts to the falcon tube. Shake for 1 minute. Centrifuge for 5 minutes at 3000 g. Transfer 2 ml of supernatant to the QuEChERS dispersive cleanup tube. Vortex for 30 seconds. Centrifuge for 5 minutes at 3000 g. Filter supernatant with 0.2 µm nylon filter. Transfer extract to an autosampler vial. (BEKOlut® SALT-Kit-AC, P/N: SK-AC-050; BEKOlut® PSA-Kit-02, P/N: PK-02)
CrossTOX
Weigh 2 g of sample into a 50 ml falcon tube. Add 10 ml of acetonitrile:water 84:16 (v/v). Vortex/shake for 15 minutes. Centrifuge for 5 minutes at 3000 g. Filter a maximum of 3 ml of supernatant through the CrossTOX column. Transfer extract to an autosampler vial. (LCTech CrossTOX® Clean-up Columns Manual processing, P/N: 17900)
Immunoaffinity chromatography solid phase extraction (IAC SPE)
Weigh 1 g of sample into a 50 ml falcon tube. Add 10 ml of MeOH:ACN:H2O 25:25:50 (v/v/v). Shake/stir for 15 minutes. Centrifuge for 5 minutes at 3000 g. 3 ml extract are diluted with 20 ml PBS + 2 % Tween20 and are passed through the IAC with a flow rate of 2-3 ml/ min. Wash column with 10 ml H2O. Remaining liquid was removed by applying slight pressure. Elute with 2.5 ml of MeOH:HAc 98:2 (v/v) and 0.5 ml H2O. For the 1st ml slight pressure/vacuum was applied. For the 2nd and 3rd ml the elution was stopped for 30 seconds after half the volume had passed. Remaining liquid residues were removed by applying slight pressure. The 3 ml of eluted extract are filtered through a 0.2 µm nylon filter. Transfer extract to an autosampler vial. (BEKOlut® IAC Afla/Ochra/ZON/DON/FUM/T2HT2, P/N: 003-AOZDFT)
Results
A 5-point calibration for FLD was set up in a range from 1.5-30 ppb for G2/B2, 0.5-10 ppb for G1/B1, 50-1000 ppb for ZON and 1-20 ppb for OTA (Tab. 1).
Tab. 1 Concentration of calibration levels in ppb (ppb=ng/ml)
")
The calculated values for limit of detection (LOD) and limit of quantification (LOQ) for measurements without matrix are below 20 ppb and within the specification of regulations (Tab. 2). For LOD a signal to noise ratio (S/N) of 3 was taken as basis. For the LOQ a ratio of S/N=10 was applied. For calculation, the chromatogram of calibration level L1 (Fig. 2) was used.

Fig. 2 Chromatogram of mixed standard at calibration level L1
Tab. 2 Comparison of LOD/LOQ without matrix and limit values in ppb, *valid for animal feeds/foodstuff

P1 – Solid liquid extraction (SLE)/ liquid-liquid extraction (LLE)
The first applied extraction procedure is the simplest and fastest one. Using this sample preparation method, the matrix removal was insufficient. For pellets, seeds, and flour samples the recovery could not be determined (data not shown). Fig. 3 shows the chromatogram of spiked hemp oil sample. All analytes were only detectable in the higher spiked sample (Tab. 3).

Fig. 3 Chromatogram of spiked hemp oil sample at level L4, SLE/LLE
Tab. 3 Recovery of mycotoxins for hemp oil sample with sample preparation P1

P2 – QuEChERS
The standard QuEChERS approach allowed to calculate recovery values for the hemp oil sample at the higher spiked level L4 (Tab. 4). For pellets, seeds, and flour samples the recovery could not be determined (data not shown). Compared to procedure P1 the recovery for aflatoxins could be increased whereas ZON and OTA were found in a similar percentage. Also, QuEChERS extraction resulted in slightly better peak shape (Fig. 4).

Fig. 4 Chromatogram of spiked hemp oil sample at level L4, QuEChERS
Tab. 4 Recovery of mycotoxins for hemp oil sample with sample preparation P2

P3 – CrossTOX
This preparation procedure is similar to P1, but instead of the 0.2 µm nylon filter, CrossTOX filter columns were used (Fig. 5). Again, reasonable values could only be calculated for the hemp oil sample (Tab. 5). Recovery rates for aflatoxins were in a comparable range as for P1, but ZON and OTA were found in lower concentrations.

Fig. 5 Chromatogram of spiked hemp oil sample at level L4, CrossTOX
Tab. 5 Recovery of mycotoxins for hemp oil sample with sample preparation P3

P4 – Immunoaffinity chromatography solid phase extraction (IAC SPE)
This preparation procedure is the most time-consuming but also was the most effective. Using the IAC SPE, all mycotoxins could be detected in all spiked samples at level L4. Nevertheless, recovery rates for the different analytes vary greatly, ranging from 20 % to 140 %. The most significant change was observed for OTA which had the lowest achieved values around 20 %, despite showing good recoveries in the other sample preparation methods. All samples showed a similar pattern, which can be seen in Fig. 6 where an overlay of the four samples spiked at level L4 after IAC SPE sample preparation is depicted. Recovery rates for the four different samples are visualized in Fig. 7.

Fig. 6 Overlay of spiked samples at level L4 after IAC SPE, hemp pellets – black, hemp seeds – green, hemp flour – blue, hemp oil – red

Fig. 7 Recovery in % for all samples spiked at level L4 after IAC SPE
Generally, the limit values were met for all sample preparation procedures. The suitability is summarized in Tab. 6. A yellow check mark indicates that the preparation method was not suitable for all analyzed matrices, while a green check mark indicates that all samples could be analyzed. The solvent consumption during analysis was the same for all samples and is therefore not considered in the table below.
Tab. 6 Comparison of different sample preparation parameters, *costs refer to used solvents and additional consumables (costs for working hours need to be considered individually)

More steps in sample preparation required more additional consumables, like for QuEChERS or IAC SPE. Therefore, these types of preparations were more time consuming and expensive per sample. However, when it comes to reaching the LODs or LOQs, the more complex procedures are more effective. Simple sample preparation methods, such as SSL/LLE, may result in more matrix suppression and thus in lower recovery rates.
Conclusion
In general, mycotoxins in the samples could only be detected at the higher spiked level L4 (see Tab. 1), due to the additional dilution factors during sample preparation. The described results indicate that not all preparation procedures were suitable for all samples. Spiked mycotoxins in the the hemp oil could be recovered using all procedures. The complexity of sample preparation is strongly dependent on the sample matrix. Challenging matrices like hemp and hemp products should be treated with more complex sample preparation procedures. The best results for these challenging matrices (pellets, seeds, flour) were obtained using the IAC SPE procedure. Nevertheless, the standard QuEChERS extraction showed a good cleanup of the samples, but recovery rates need to be optimized. A modification of the standard QuEChERS approach, for example a combination of QuEChERS and CrossTOX, could be meaningful.
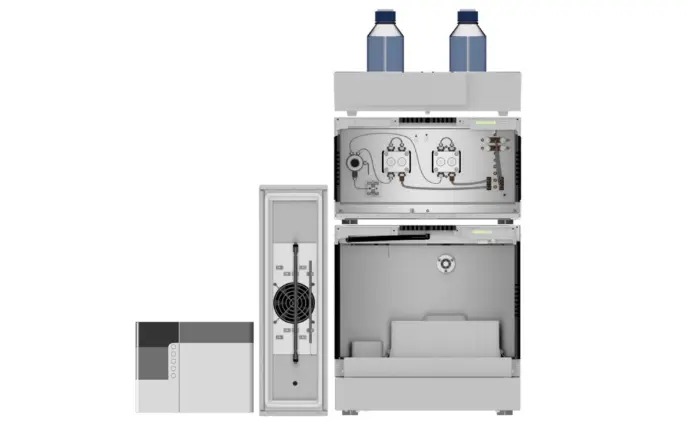
Tab. 7 System configuration
Instrument | Description | Article No. |
Pump | AZURA® P 6.1L HPG, 5 ml, 1000 bar | |
Autosampler | AZURA® AS 6.1L, cool/heat, 1240 bar | |
Thermostat | AZURA® CT 2.1 | |
Detector FLD | Shimadzu RF-20A, 200 – 650 nm | |
Software | ClarityChrom 8.7 – Workstation, autosampler control included | |
Column | Eurospher II 100-2 C18, 150 x 2 mm ID |
Tab. 8 Method parameters

References
[1] Guidance for Industry: Action Levels for Poisonous or Deleterious Substances in Human Food and Animal Feed; https://www.fda.gov/regulatory-information/search-fda-guidance-documents/guidance-industry-action-levels-poisonous-or-deleterious-substances-human-food-and-animal-feed#afla, 13/01/2023
[2] COMMISSION REGULATION (EU) 2023/915 of 25 April 2023 on maximum levels for certain contaminants in food and repealing Regulation (EC) No 1881/2006
[3] AOAC SMPR® 2021.010, Standard Method Performance Requirements (SMPRs®) for Quantitative Analysis of Mycotoxins in Cannabis Biomass and Cannabis-Derived Products
Application details
Method | HPLC |
Mode | RP |
Substances | aflatoxin G2, aflatoxin G1, aflatoxin B2, aflatoxin B1, ochratoxin A, zearalenone |
CAS number | 7241-98-7, 1402-68-2, 7220-81-7, 1162-65-8, 303-47-9, 17924-92-4 |
Version | Application No.: VFD0192 | Version 2 11/2023 | ©KNAUER Wissenschaftliche Geräte GmbH |