Science with Passion

Application No.: VBS0083 Version 1 04/2024
Quality control of oligonucleotides using HPLC coupled to UV and MS detection
J. Kramer1, U. Krop1, G. Greco1, T. Pöhlmann2, C. Matthäus2; kramer@knauer.net
1 KNAUER Wissenschaftliche Geräte GmbH, Hegauer Weg 38,
14163 Berlin; www.knauer.net
2 BianoGMP GmbH, Ronneburger Straße 74, 07546 Gera, Germany

Summary
The quantification of oligonucleotides can easily be done by UV detection because oligonucleotides show strong absorption at 260 nm. Expanding the UV method for quality control with mass spectrometry results in mass confirmation and impurity identification.
Introduction
During the last two decades oligonucleotides have become an important tool in basic research and a potent technology for drug development. These oligonucleotide-based drugs proved their therapeutic potency and showed an excellent toxicology profile. One aspect in the manufacturing process is the purification of the active pharmaceutical ingredient (API) and its separation from unwanted side products. To assure the successful synthesis and purification, analytical quality control is mandatory. The quality control requires a confident confirmation of oligonucleotide mass as well as quantification of impurities. Aborted sequences especially N-1 are often not baseline separated, which complicates a reliable quantification. Other impurities that occur because of degradation, as for instance depurination, cannot be separated sufficiently from the main peak. Such co-eluting impurities can be accurately quantified by a mass spectrometer. Liquid chromatography, especially ion pair-reversed phase (IP-RP) HPLC is one of the most widely used methods for the analysis of oligonucleotide impurities [1]. The below application shows a possible workflow, using an exemplary sample, for the characterization of oligonucleotides and impurity quantification via LC-UV and LC-MS. In this work we collaborated with BianoGMP GmbH. The company specialised in the production of high purity and quality oligonucleotides and has many years of experience in the development of therapeutic oligonucleotides with a focus on GMP services and oligonucleotide analytical methods.
Sample Preparation
The sample used was a 26-mer oligonucleotide with a nominal mass of 8369.9 Da provided by BianoGMP GmbH in Gera, Germany. A solution of 10 mg/ml was prepared by adding 2.5 ml water to 25 mg of reference standard. Next, the 10 mg/ml solution was diluted with water in a ratio 1:10 to a concentration of 1 mg/ml. The 1:10 dilution contained 119.5 nmol of substrate in 1 ml. This was diluted to 25 nmol/ml. Therefore, 209.2 μl of the 1 mg/ml solution was filled up to 1 ml. For analysis, 2 μl of 25 nmol/ml solution were injected, which corresponds to an absolute substance quantity of 50 pmol.
Results
The oligonucleotide was analyzed under ion-pairing reversed phase conditions using an aqueous solution containing hexafluoro isopropanol (HFIP) and triethylamine (TEA) as eluent A and 100 % methanol as eluent B. An injection volume of 2 µl of the reference solution (25 nmol/ml) was injected. The UV absorption at 260 nm was recorded. Fig. 1 shows the UV chromatogram of the injected sample. Peak area, peak height and retention time can be calculated by the software and be used for quantification.
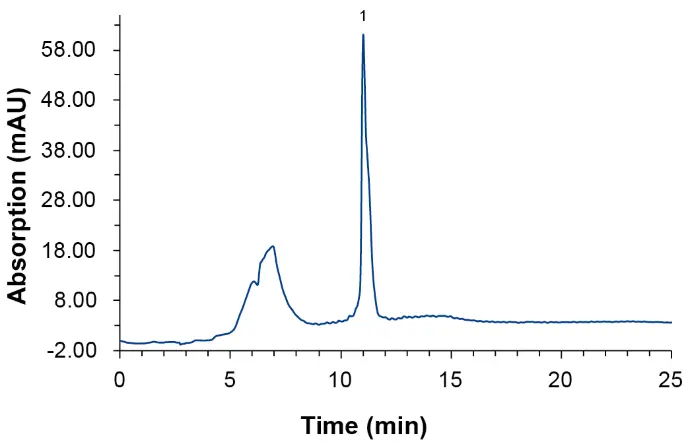
Fig. 1 UV trace of oligonucleotide sample at 260 nm
After UV detection, the sample was further analyzed with a triple quadrupole mass spectrometer. The sample was analyzed using electrospray ionization (ESI) with negative polarity. Fig. 2 shows the Total Ion Current (TIC) for the oligonucleotide sample.
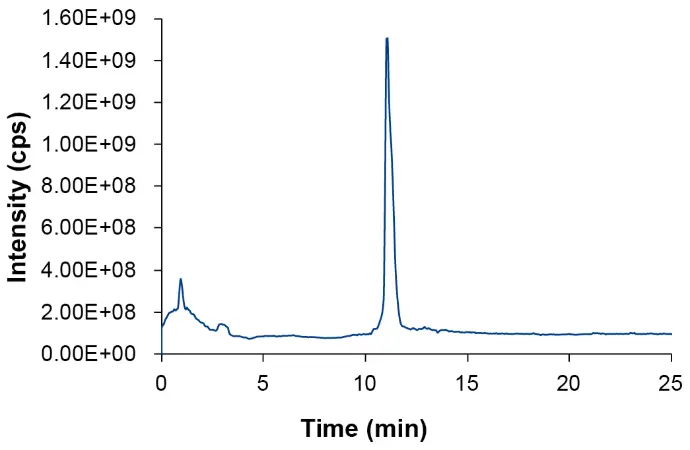
Fig. 2 TIC of oligonucleotide sample
The first quadrupole (Q1) of the MS was used for a scan in the range of 500 Da to 1250 Da. The spectrum (Fig. 3) was extracted based on the retention time as seen in the TIC. The mass spectrum clearly showed the series of deprotonated charge states (z = 7 to 15). The charge state distribution can fluctuate depending on the specific oligonucleotide examined and other parameters such as the pH value of the solution.
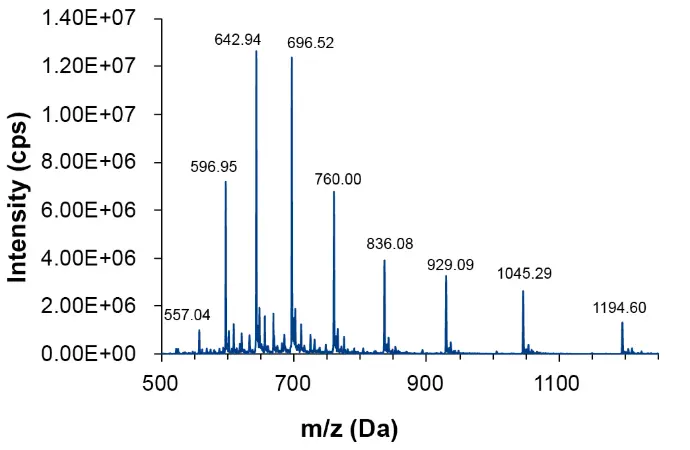
Fig. 3 Q1 spectrum of oligonucleotide sample from 10.95 to 11.27 minutes, m/z 500–1250 Da
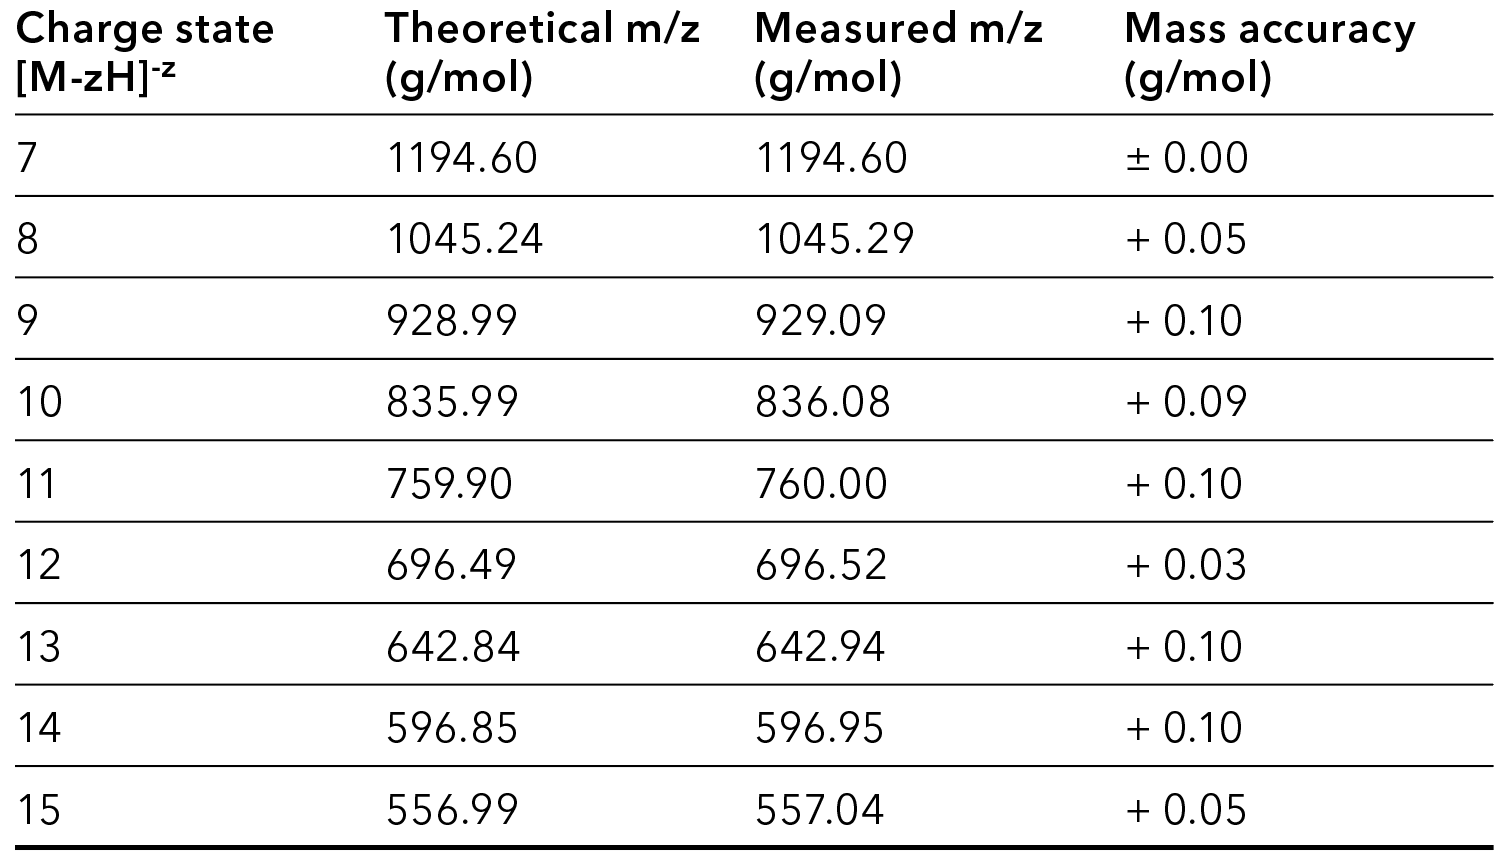
The comparison of theoretical and measured mass was used for oligonucleotide mass confirmation. The deviations were accurate for analyte confirmation by m/z species detection.
Tab. 1 Comparison of calculated and determined m/z values for the main product, Q1 scan
Aborted sequences (N-x) are often chormatographically not well separated from the complete sequence (N) or one another, because of their small mass differences. This is especially true for N-1 where small amounts are obscured by the front slop of the main product peak of much greater peak area. The individual oligonucleotide impurities N-1 for the charge states with the highest intensity, here m/z=12 and m/z=13, were investigated. The detailed spectrum for N-1 at a charge state m/z=13 compared to the main peak is displayed in Fig. 4. The mass accuracy of theoretical and measured mass is 0.10 Da for the main product peak and 0.01 Da for the peak of the N-1 impurity.
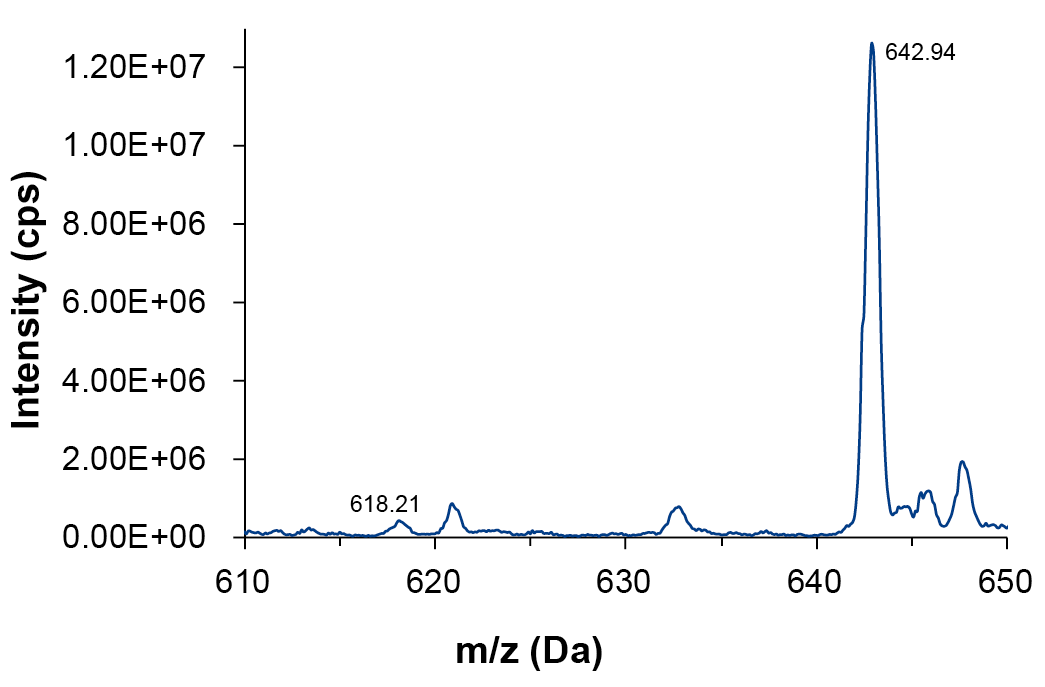
Fig. 4 Q1 spectrum in a range from 610 – 650 Da, m/z=13, main peak (642.94) and N-1 impurity (618.21)
The used oligonucleotide is a full-thioate 26-mer. Therefore, depurinated (NDEP) degradation products and back-substitution of sulfur with oxygen (NPO) need to be considered. The most intense charge state visible in the Q1 scan, here at 642.94 Da (z=13), was chosen for quantification of those co-eluting impurities. Quantification was conducted using a multiple ion monitoring (Q1MI). The extracted single ions, NDEP and NPO, and the main peak at m/z=13 from the Q1MI experiment are displayed in Fig. 5.
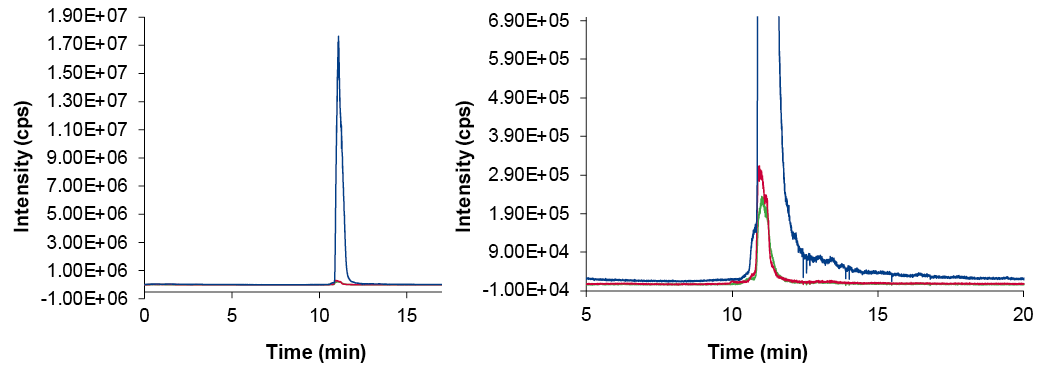
Fig. 5 XIC of SIM at m/z=13 (left), enhanced view of XIC (right), blue – Main peak, red – NPO, green – NDEP
The amount of impurity was calculated as a percentage in relation to the area of the main peak (Fig. 6), but of course a common calibration at different concentration levels can be used.
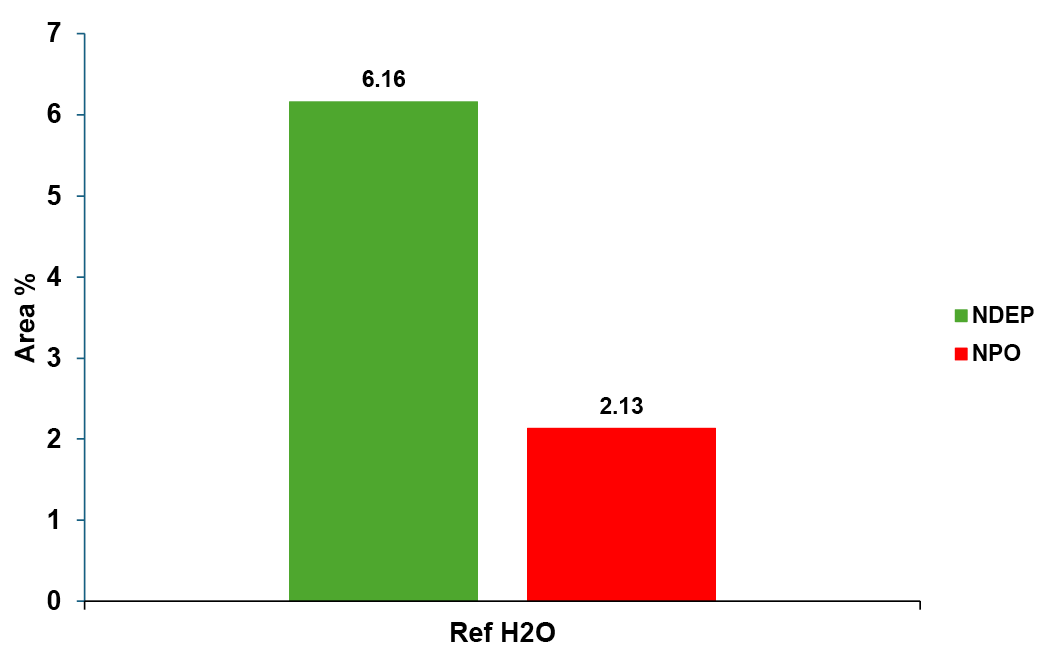
Fig. 6 Area % of impurities from SIM at m/z=13 in relation to main peak (100%)
In the reference solution values for NDEP around 6 % in relation to the main peak and for NPO around 2 % in relation to the main peak were to be expected.
Conclusion
Expanding the HPLC-UV method for quality control with MS benefits in mass confirmation and impurity identification. Impurities such as aborted sequences (N-1), depurination products or other modifications can be investigated although they are not, or not sufficiently, separated from the complete sequence (N). HPLC coupled with negative ESI-MS provides a reliable method with unique capabilities for separation and identification of (therapeutic) oligonucleotides. The described workflow only made use of the first quadrupole, but MS/MS or MRM experiments can be useful for the quantitative analysis of low-level oligonucleotide impurities and co-eluting substances.
Material and Methods
Tab. 2 System configuration
Instrument | Description | Article No. |
Pump
| AZURA® P 8.1L UHPLC |
|
Autosampler | AZURA® AS 6.1L, 1240 bar, cooling/heating version
|
|
UV detector | AZURA® DAD 6.1L
|
|
UV flow cell
| Standard KNAUER LightGuide UV Flow Cell Cartridge
|
|
Thermostat
| AZURA® CT2.1 |
|
LC software
| ClarityChrom 9.0.0 - Workstation, autosampler control included
|
|
MS
| Sciex Triple Quad™ 5500+ System – QTRAP® Ready
| – |
MS Software
| Sciex OS 3.2
| – |
Column
| Waters XBridge Oligonucleotide BEH C18 column, 50 x 4.6 mm ID, 2.5 µm, 130 Å
| – |
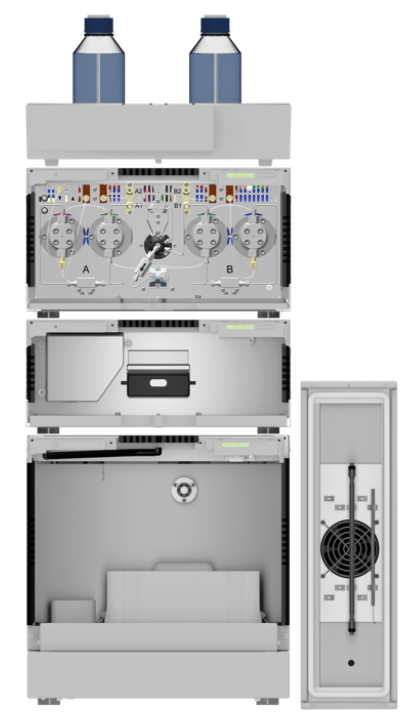
Fig. 7 LC system configuration
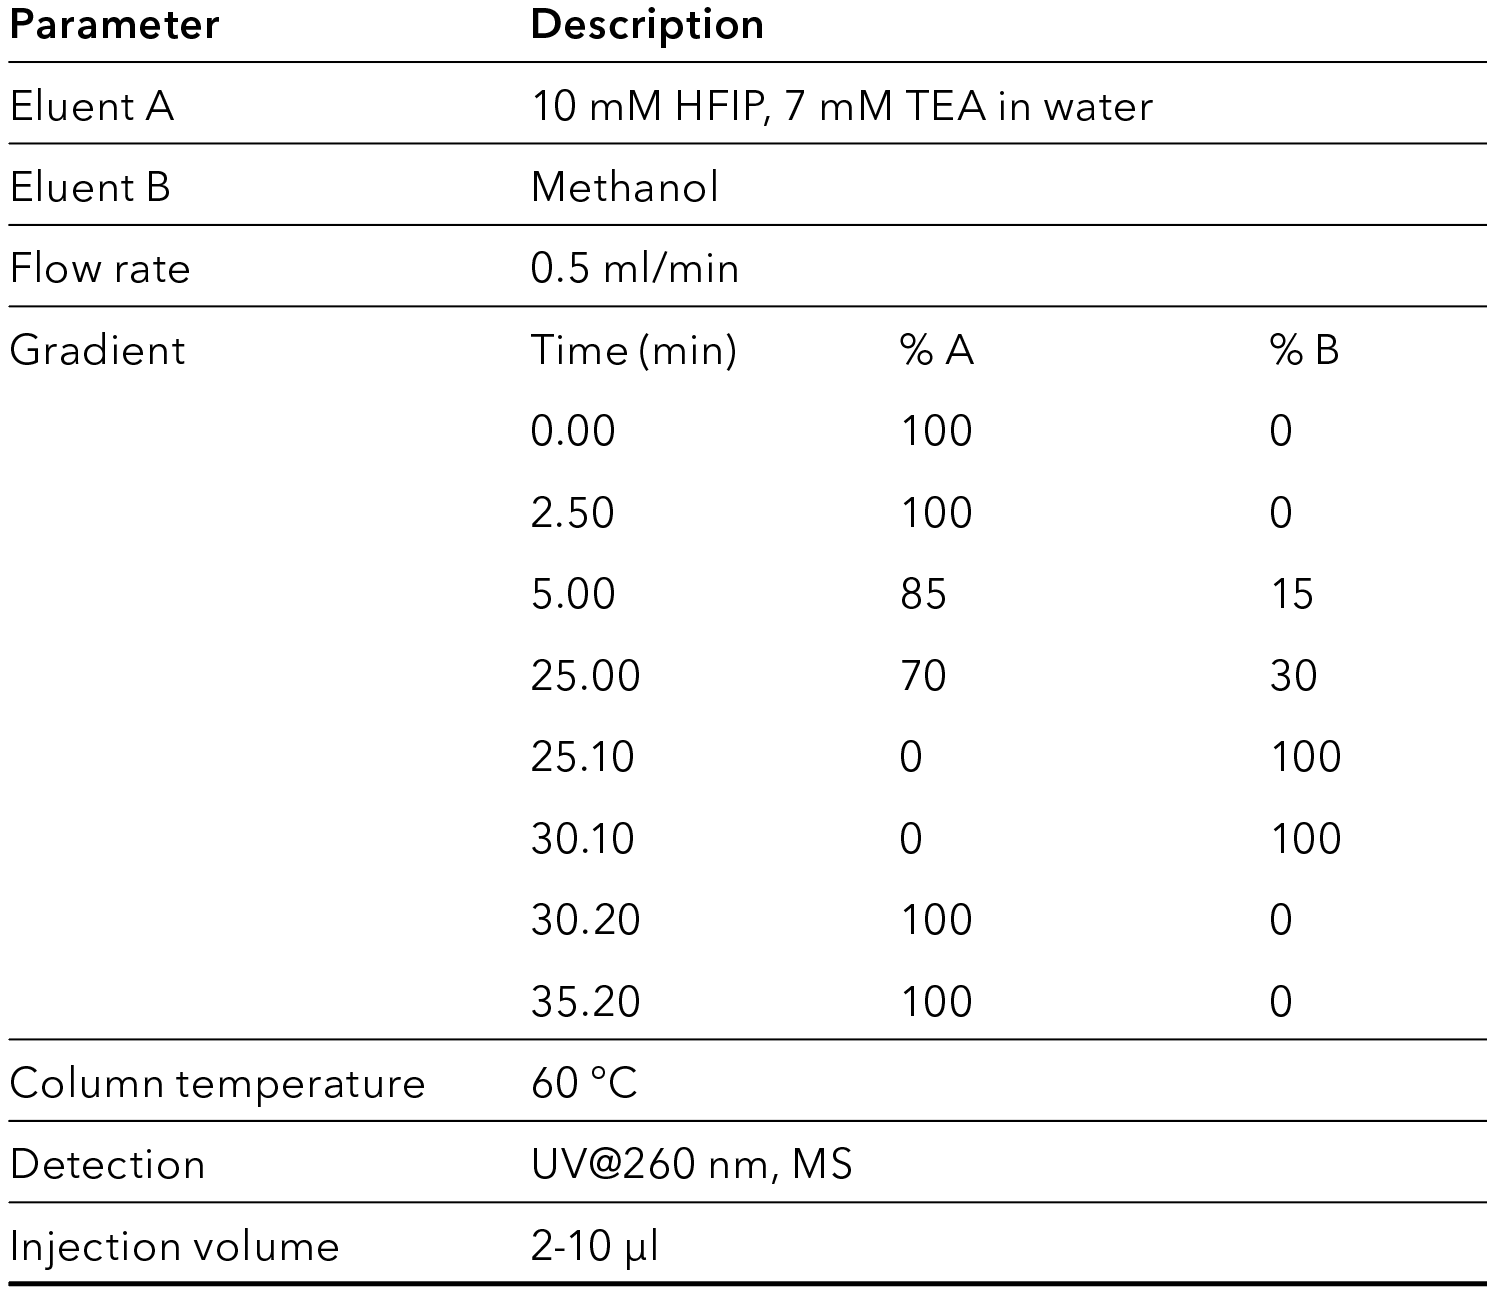
Tab. 3 LC method settings
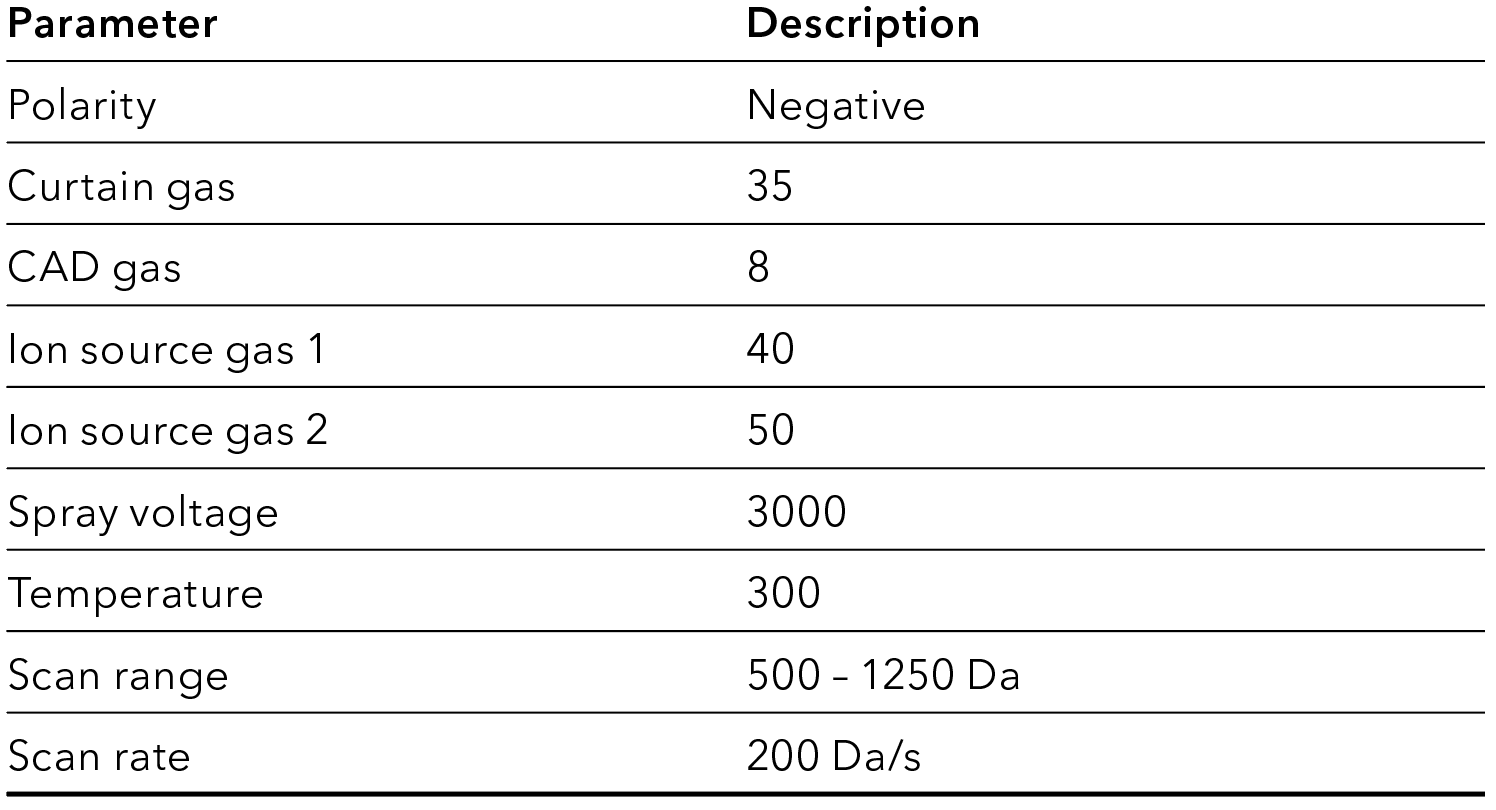
Tab. 4 MS method settings
References
[1] Journal of Chromatography B 1169 (2021) 122611; Determination of individual oligonucleotide impurities by small amine ion pair-RP HPLC MS and MS/MS: n - 1 impurities; Stilianos G. Roussis, Andrew A. Rodriguez, Claus Rentel; https://doi.org/10.1016/j.jchromb.2021.122611
Application details
Method | LC-MS |
Mode | RP |
Substances | Oligonucleotide |
CAS number | n/a |