Science with Passion

Application No.: VBS0085 Version 1 03/2025
Easy and reliable fractionation for polysome profiling
U. Krop1, T.B.N. Ly-Hartig2, N. Muthukumarana2; krop@knauer.net
1 KNAUER Wissenschaftliche Geräte GmbH, Hegauer Weg 38,
14163 Berlin; www.knauer.net
2 Medizinische Fakultät Mannheim, Mannheim Institute for Innate Immunoscience (MI3), Franz-Volhard-Straße 6, 68167 Mannheim
Illustration: Adobe Firefly
Summary
Protein synthesis is a crucial process for all living organisms. Key to this process is the translation of mRNA into protein, which takes place on ribosomes located in the cytoplasm. To speed up protein synthesis, several ribosomes bind to the mRNA molecule to form a polysome. Profiling polysomes gives therefore valuable information about the translational activity of the cell. During the profiling protocol mRNA, ribosomes and polysomes are separated by sucrose gradient centrifugation and then fractionated afterwards for subsequent analysis. Here, we describe a standard FPLC system for the reliable fractionation of polysomes. The system includes a fiber optic flow cell to prevent peak broadening and uses the conductivity signal for an optimized fractionation start. This approach optimizes the fractionation of polysomes.
Introduction
Over the past years, there has been a huge interest in the role of translational regulation of gene expression in organisms. During translation the nucleotide sequence of a messenger RNA (mRNA) is translated into the amino acid sequence of a protein. Ribosomes, which are macromolecular complexes found in cells, are essential for protein synthesis [1].
Ribosomes are characterized by their sedimentation coefficient S (Svedberg). In eucaryotic cells ribosomes are composed of a small 40S subunit and a large 60S subunit forming in total an 80S ribosome. The subunits are composed of several proteins and ribosomal RNA (rRNA). The most prominent rRNA in the large 60S subunit is the 28S rRNA, whereas in the 40S subunit the 18S rRNA is found. These rRNAs are characteristic of the specific subunits. All together the components form the translational apparatus. The efficiency of translation is increased by the formation of polysomes. A polysome is a group of ribosomes attached to an mRNA molecule, arranged in a linear manner. They were initially described in the 1960s by Wettstein et al. emphasizing their significant role in protein synthesis and first referred to them as "ergosomes" [2].
Polysome profiling has been developed to study the translational status of a specific mRNA species or to analyse the translatome, the subset of mRNAs that are actively translated in a cell. This provides a valuable insight into the translational activity of the cell. The mRNA is separated depending on the number of bound ribosomes using a sucrose gradient, allowing the separation of free mRNA, unbound 40S and 60S subunits, 80S monosomes, and actively translating mRNAs bound by two or more ribosomes. It can be combined with global analysis tools such as DNA microarrays or high-throughput RNA sequencing to identify the RNA [3, 4]. Here we describe the fractionation of polysomes using a dedicated FPLC system.
Workflow for Polysome Profiling and Sample Preparation
Sample preparation was performed as previously described by Hoert et al. [4]. An overview of the workflow is shown in Figure 1. Briefly, cell lysates were prepared from cultured HCT 116 cells. The lysates containing free mRNA, ribosomes and polysomes were then separated by sucrose density (17.5–50%) gradient centrifugation. After centrifugation the gradient tube was clamped into the siFractor and connected to the AZURA® FPLC system. The bottom of the tube is pierced, and the gradient was displaced with 60% sucrose solution. Fractionation was triggered by the conductivity signal. Collected fractions were analyzed by denaturating gel electrophoresis. Subsequent analysis of the fractions using other techniques is also possible.
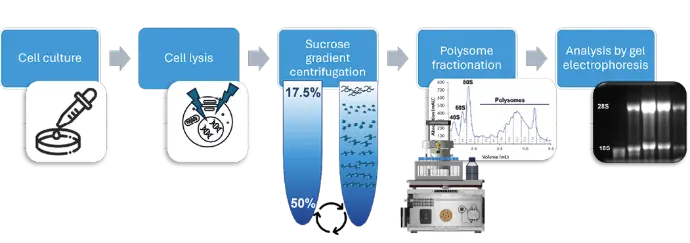
Fig. 1 Exemplary workflow for polysome profiling
Results
The polysomes were fractionated using an FPLC with an isocratic pump (Figure 2). The tube containing the sucrose gradient is placed between the multi-injection valve and the UV detector flow cell using the siFractor device (not shown). The sucrose gradient is analyzed from top to bottom by displacing the gradient with 60% sucrose solution. The sucrose solution used to move the formed gradient can be pumped either from a variable sample loop (e.g. superloop) or directly from the system pump. The use of a variable sample loop avoids contact between the system pump and the sucrose solution but is more complex to set up and requires additional steps to fill the loop. In the case shown, the 60% sucrose solution was pumped directly through the pump. To prevent the formation of sugar crystals, an extensive pump rinsing procedure has been incorporated into the system's shutdown routine. The UV detector is equipped with a fiber optic flow cell which allows placing the flow cell directly at the outlet of the gradient tube, eliminating unnecessary dead volume and peak broadening. To increase the reproducibility of the collected fractions, the conductivity signal was used to trigger fractionation.
Figure 3 shows a representative chromatogram for the polysome fractionation. Free mRNAs and tRNAs elute first, followed by the small ribosomal subunits (40S), the large ribosomal subunits (60S) and monosomes (80S). Between 2.5 and 4.5 ml the polysomes elute from the gradient. Each peak corresponds to a specific number of ribosomes bound to mRNA.
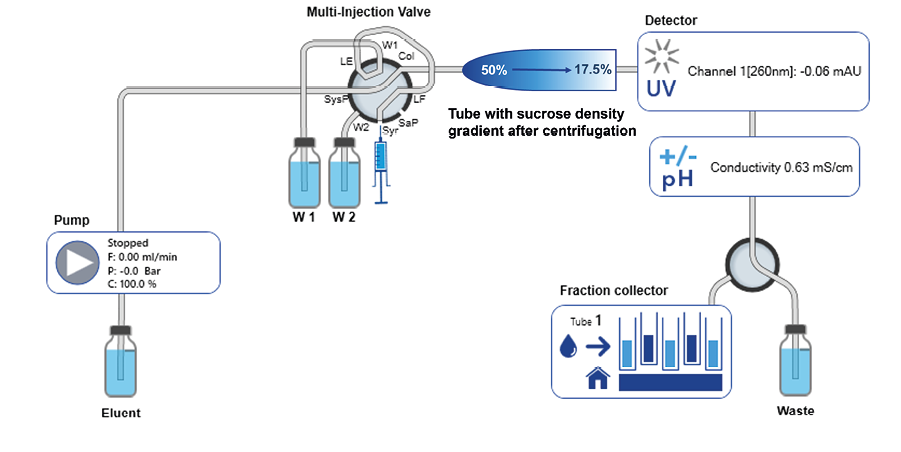
Fig. 2 FPLC system flow path and connection of gradient tube clamped into siFractor
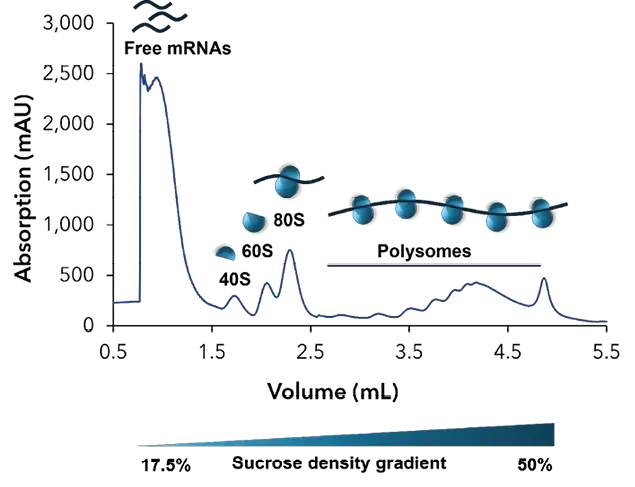
Fig. 3 Representative chromatogram of sucrose gradient profile
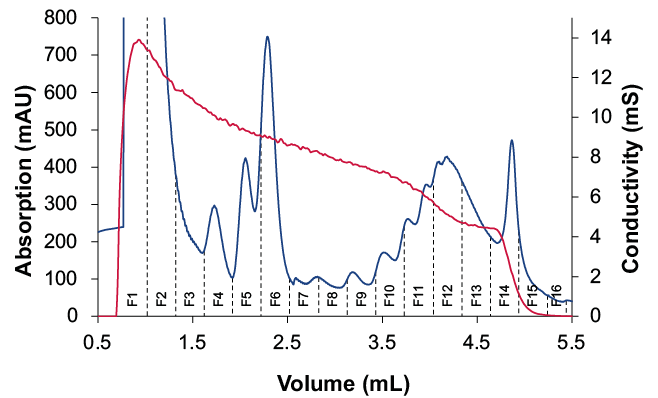
A more detailed view of the polysome fractions is shown in Figure 4A. The conductivity signal corresponds to the start of the sucrose gradient and was used as a threshold to start fractionation. The collected fractions were analyzed by gel electrophoresis (Fig. 4B).
(A)
(B)
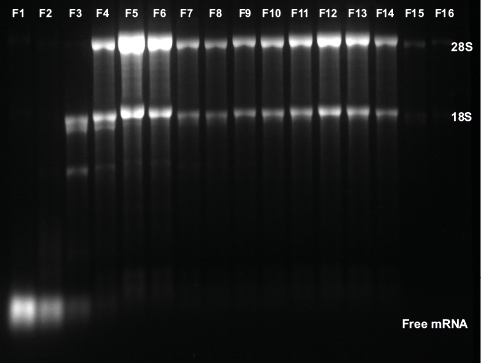
Fig. 4 Fractionation for polysome profiling. (A) Zoom in chromatogram of sucrose gradient and collected fractions, UV trace (blue), conductivity (red), threshold of 1mS/cm was used as trigger for fractionation start (B) analysis of fraction by gel electrophoresis
The large peaks represent free mRNAs and tRNAs. The small 40S subunit corresponds to 18S rRNA and the 28S rRNA can be found in the large 60S subunits. Consequently, the ribosome and polysome fractions include 18S and 28S mRNA.
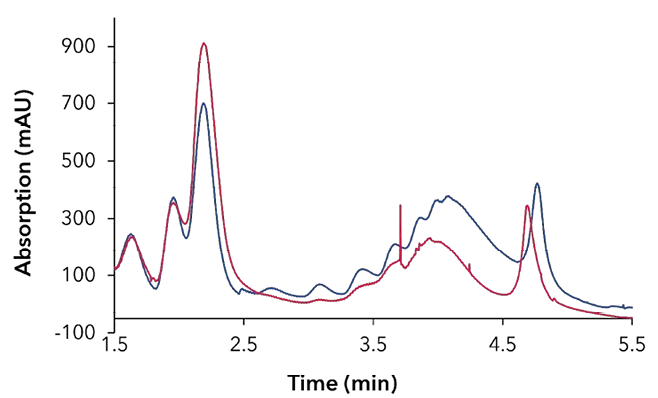
Polysome profiling can be used to analyze the translational activity of the cell. An example data set is shown in Figure 5. Here, a comparison of control and inhibitor-treated cells shows a clear reduction in polysomes (Fig. 5 A), which is also confirmed by the reduced amount of 18S
and 28S mRNA in the polysomal fractions (Fig. 5 B). By using the conductivity signal as threshold to trigger sampling, the starting point of fractionation is standardized, and the fractions can be compared more accurately.
(A)
(B)
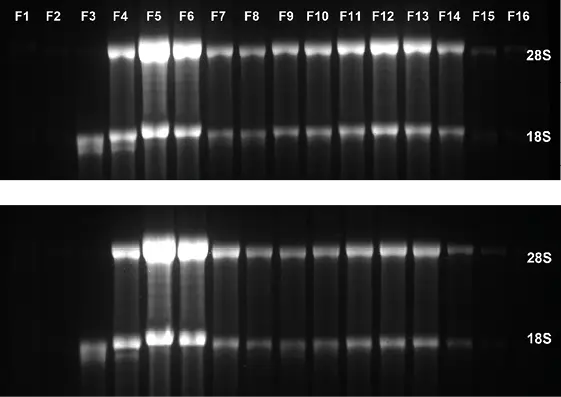
Fig. 5 Polysome profiling (A) chromatogram of sucrose gradient (blue) DMSO treated control cells, (red) cells treated with an inhibitor, (B) analysis if fractions by gel electrophoresis (top) DMSO treated control cells (below) cells treated with an inhibitor
Conclusion
Polysome profiling is a well-known technique for analyzing the translation status of cells. Here, a simple and convenient FPLC system is described for optimized fractionation of ribosomes and polysome after sucrose gradient centrifugation. By using the conductivity signal as threshold to trigger sampling, the starting point of fractionation is standardized, and the fractions can be compared more efficiently. In addition, the use of a fiber optic flow cell reduces dead volume and prevents peak broadening. Fractionation of polysomes and ribosomes with the optimized AZURA FPLC is reliable, convenient, and allows subsequent analysis of the fractions by gel electrophoresis or additional analysis for polysome profiling.
Material and Methods
Tab. 1 FPLC system configuration
Instrument | Description | Article No. |
ASM 2.2L | AZURA® Assistant ASM 2.2L basic unit | |
P4.1S Pump | Compact pump with pressure sensor, | |
V4.1 Valve drive | Universal valve drive for ASM 2.2L | |
Multi injection valve | Multi-injection valve, biocompatible | |
UVD 2.1S-fiber optics detector | Compact variable single wavelength UV detector with fiber optics for ASM 2.2L | |
UV Flow cell | Semi-preparative bio-compatible 3 mm UV Flow Cell, 1/16" Fiber Optics Version | |
Conductivity Monitor | Conductivity monitor mikron 81 with biocompatible flow cell | |
FC 6.1 | Fraction collector | AFA00 |
Rack | Rack for 165 tubes 1/1.5/2 ml (11 mm) for FC 6.1 | AFR01 |
SiFractor | device for fractionation of samples contained within polypropylene tubes used in centrifugation applications | n.a. |
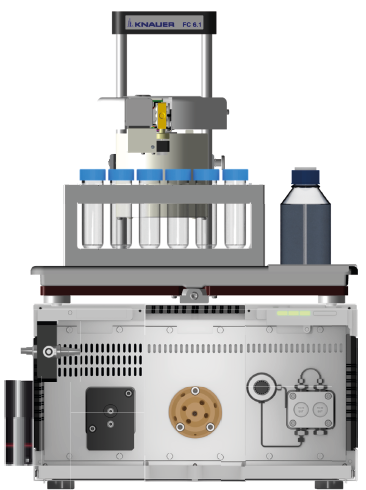
Fig. 6 FPLC system configuration
Tab. 2 FPLC method settings
Parameter | Description |
Displacement solution | 60% Sucrose |
Flow rate | 1 ml/min |
Run time | 6 min |
Temperature | Ambient |
Detection | UV 260 nm, conductivity monitor |
Data rate | 10 Hz |
Fractionation | Fractionation triggered by conductivity signal threshold |
References
[1] Alberts B, Johnson A, Lewis J, et al. Molecular Biology of the Cell. 4th edition. New York: Garland Science; 2002. From RNA to Protein. Available from: https://www.ncbi.nlm.nih.gov/books/NBK26829/
[2] Wettstein Fo, Staehelin T, Noll H. Ribosomal aggregate engaged in protein synthesis: characterization of the ergosome. Nature. 1963 Feb 2;197:430-5. doi: 10.1038/197430a0. PMID: 14000153.
[3] Shaffer D, Rollins JA. Fluorescent Polysome Profiling in Caenorhabditis elegans. Bio Protoc. 2020 Sep 5;10(17):e3742. doi: 10.21769/BioProtoc.3742. PMID: 33659402; PMCID: PMC7842706.
[4] Hoerth K, Reitter S, Schott J. Normalized Ribo-Seq for Quantifying Absolute Global and Specific Changes in Translation. Bio Protoc. 2022 Feb 20;12(4):e4323. doi: 10.21769/BioProtoc.4323. PMID: 35340296; PMCID: PMC8899559.
Application details
Method | FPLC |
Mode | Other |
Substances | Ribosome, cell lysates |
CAS number | # |