Understanding the Fundamentals of High-Performance Liquid Chromatography
Liquid chromatography is a well-established technique for the separation of substances. High performance liquid chromatography (HPLC) is a suitable method for the analysis of a wide range of application areas. Here, we describe the principle of HPLC and introduce to the most important components in an HPLC system and the factors that determine the success of a measurement.

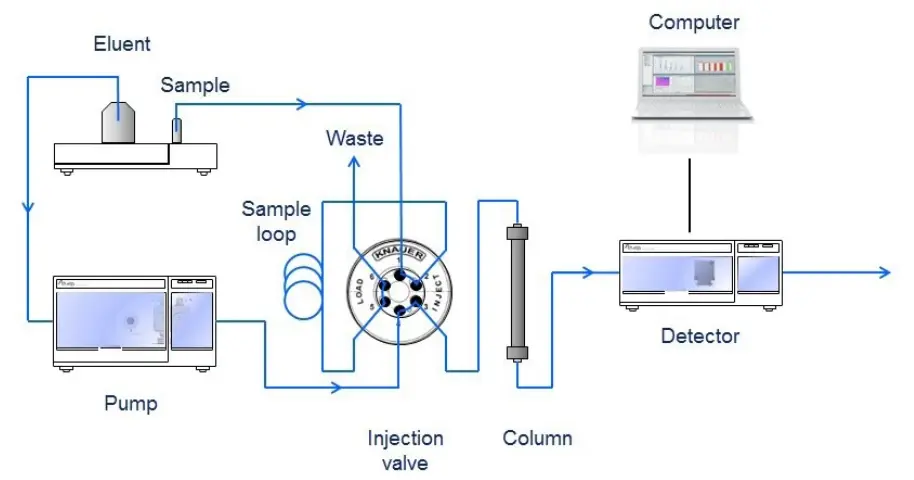
Fig. 1 Schematic layout of a HPLC system
Principle of HPLC
The separation principle of HPLC is based on the distribution of the analyte (sample) between a mobile phase (eluent) and a stationary phase (packing material of the column). Depending on the chemical structure of the analyte, the molecules are retarded while passing the stationary phase. The specific intermolecular interactions between the molecules of a sample and the packing material define their time “on-column”. Hence, different constituents of a sample are eluted at different times. Thereby, the separation of the sample ingredients is achieved.
A detection unit (e.g. UV detector) recognizes the analytes after leaving the column. The signals are converted and recorded by a data management system (computer software) and then shown in a chromatogram. After passing the detector unit, the mobile phase can be subjected to additional detector units, a fraction collection unit or to the waste. In general, a HPLC system contains the following modules: a solvent reservoir, a pump, an injection valve, a column, a detector unit and a data processing unit (Fig. 1). The solvent (eluent) is delivered by the pump at high pressure and constant speed through the system. To keep the drift and noise of the detector signal as low as possible, a constant and pulseless flow from the pump is crucial. The analyte (sample) is provided to the eluent by the injection valve.
Gradient vs. Isocratic

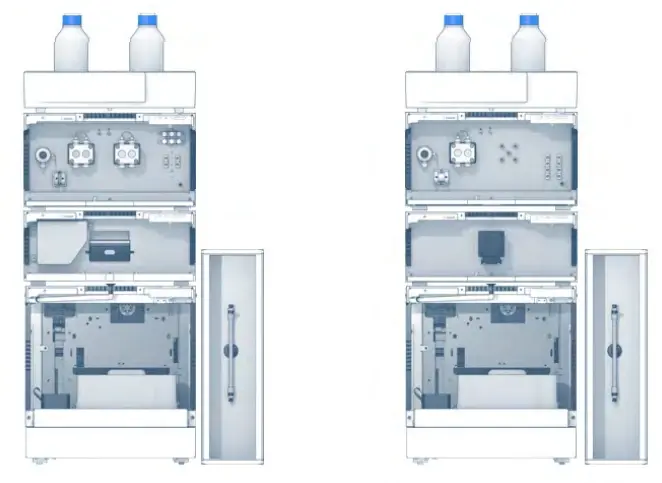
Fig. 2 Analytical HPG (left) and LPG (right) system configuration with autosampler and column thermostat
Depending on the composition of the mobile phase, two different modes are generally applicable. If the makeup of the mobile phase remains constant during the separation process, the HPLC system is defined as an isocratic elution system. When the composition of the mobile phase is changed during separation, the HPLC system is defined as a gradient elution system. [1,2] Using a gradient system, two different techniques are available: a low-pressure gradient (LPG) and a high-pressure gradient (HPG). A low-pressure gradient means that the mixing of the solvents is carried out upstream of the pump (suction side). In a high-pressure gradient system, the different solvents are supplied by individual pumps and mixed after the pumps (discharge side). [1] Fig. 2 shows exemplary system configurations for an LPG and an HPG gradient mode.
Columns
The column represents the heart of any HPLC system. It is responsible for the adequate separation of the sample ingredients. The separation efficiency correlates with the column inner diameter, the length of the column and the type and particle size of the column packing material. Depending on the desired application, numerous HPLC columns are commercially available. Different packing materials support different separation mechanisms – common are materials for normal-phase, reversed-phase, size exclusion, ion exchange, affinity, chiral, or hydrophilic interaction HPLC. [1] In Fig. 3 an analytical and a preparative column are shown.

Fig. 3 Analytical and preparative column
Detectors
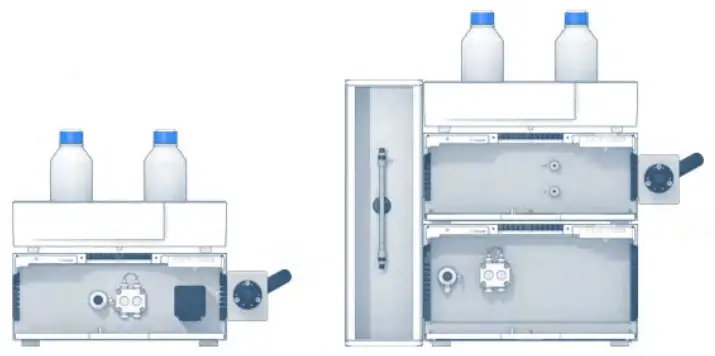
The task of the detector unit is to register the time and amount of a substance which is eluted from the column. The detector perceives the change in the composition of the eluent and converts this information into an electrical signal which is evaluated by the aid of a computer. [1] A variety of detectors is available depending on the structural characteristics of the analyte. Common detector units are refractometric, UV/VIS, electrochemical and fluorescence detectors. Fig. 4 shows two isocratic system configurations with different detectors.

Fig. 4 Isocratic system configuration with a single wavelength UV-detector (left) and a refractive index detector (right)
Chromatographic Parameters
The separated analytes which are transported by the mobile phase are recorded as signal peaks by the detector unit. The total amount of all peaks is called chromatogram. Each individual peak provides qualitative and quantitative information of the analyte. Qualitative information is given by the peak itself (e.g.: shape, intensity of the signal, time of appearance in the chromatogram). In addition, the area of a peak is proportional to the concentration of the substance. Hence, the chromatography data management software can calculate the concentration of the sample by integration. This provides quantitative information. Ideally the peaks are recorded as a Gaussian bell-shaped curve. A schematic example is illustrated in Fig. 5. The basic parameters of a chromatographic separation are discussed below.
![Fig. 5 Schematic illustration of a chromatogram [3] Fig. 5 Schematic illustration of a chromatogram [3]](/web/image/135239-81bda3e8/vsp0019_fig5.webp?access_token=48dbe68f-91af-4246-9952-2b274eae0892)
Fig. 5 Schematic illustration of a chromatogram [3]
Delay time (t0)
The delay time refers to the time which is required for a non-retarded compound to be transported from the injection site to the detector unit (where the compound is recorded). During this time, all sample molecules are exclusively located in the mobile phase. In general, all sample molecules share the same delay time. The separation is caused by differing adherence of the substances with the stationary phase.
Retention time (tR)
The retention time refers to the time which is required for a compound from the moment of injection until the moment of detection. Accordingly, it represents the time the analyte is in the mobile and stationary phase. The retention time is substance-specific and should always provide the same values under the same conditions.
Peak width (w)
The peak width covers the period from the beginning of the signal slope until reaching the baseline after repeated drop in the detector signal.
Tailing Factor (T)
In practice, perfectly symmetric peaks are very rare. In a chromatogram they often show some degree of tailing. Peak tailing is measured by the tailing factor T. This factor describes the peak asymmetry, i.e. to which extent the shape is approximated to the perfectly symmetric Gaussian curve. The tailing factor is measured as: T=b/a a represents the width of the front half of the peak, b is the width of the back half of the peak. The values are measured at 10 % of the peak height from the leading or trailing edge of the peak to a line dropped perpendicularly from the peak apex (see Fig. 5 on the right). [4] T = 1 represents a symmetrical peak. For T > 1 the peak profile is named tailing. For T < 1 the peak profile is named fronting.