Science with Passion
Application No.: VPH0083 Version 1 / 11/2024
Targeted LC-MS/MS detection of lipid impurities in lipid nanoparticles
M. Prüfer, G. Greco; pruefer@knauer.net
KNAUER Wissenschaftliche Geräte GmbH, Hegauer Weg 38, 14163 Berlin

Illustration: KNAUER
Summary
Lipid nanoparticles (LNPs) became famous for the rapid development and large-scale production of vaccines during the COVID-19 pandemic. Theses vaccines consist of mRNA coding for an antigen encapsulated in LNPs. Because the mRNA is sensitive to inactivation by distinctive oxidation products of the lipids, special care in quality control of the formulations and raw materials is required. Here, we suggest a workflow for HPLC-MS/MS detection of lipid related impurities in LNP formulations, independent of impurity standards.
Introduction
Lipid nanoparticles (LNPs) are a novel drug delivery system which helped combating the COVID-19 pandemics with novel vaccines. The nanoparticles are formed by rapid mixing of an organic phase containing the lipids and an aqueous phase with oligonucleotides. During this process, the active pharmaceutical ingredient (API) is encapsulated in a self-assembled lipid envelope. Currently, the potential of LNPs for several other vaccines and therapeutic applications is investigated.
With the success of this new drug type comes the responsibility of quality control. Besides other criteria, lipid content and identity must be assessed [1]. In our application note VPH0078, a high-throughput HPLC-ELSD (evaporative light scattering detection) method for analyzing the lipid content is suggested. Here, we demonstrate the development of an HPLC-MS/MS method for the detection of lipid impurities with KNAUER Azura® HPLC and the Sciex Triple Quad™ 5500+ mass spectrometer system.
A suitable separation method for lipids and possible impurities was derived from the KNAUER application note VPH0078 [2]. The MS was optimized and calibrated using standards of the lipids used in the BioNTech-Pfizer vaccine against COVID-19. A list of the most important impurities of this LNP formulation was compiled from literature research. Some of the impurities were already detected in lipid raw materials, including one impurity which can reportedly affect mRNA stability. The newly developed LC-MS/MS method was applied for a stability study on empty and loaded LNPs formulated with the KNAUER Impingement Jets Mixer (IJM) NanoScaler.
Sample Preparation
The lipids used for HPLC-MS/MS method development and calibration were provided as LNP-0315 exploration kit by Cayman Chemical. The kit contains the lipids of the vaccine BNT162b2 developed by BioNTech-Pfizer, which are cholesterol, the phospholipid 1,2-Distearoyl-sn-glycero-3-PC (DSPC), the PEGylated lipid ALC-0159 and the ionizable lipid ALC-0315. Stearic acid was obtained from Sigma-Aldrich. All analytes were dissolved in gradient grade ethanol or provided as a solution. Dilutions as single or mix standards were prepared in ethanol or ethanol:water 90:10 (v/v).
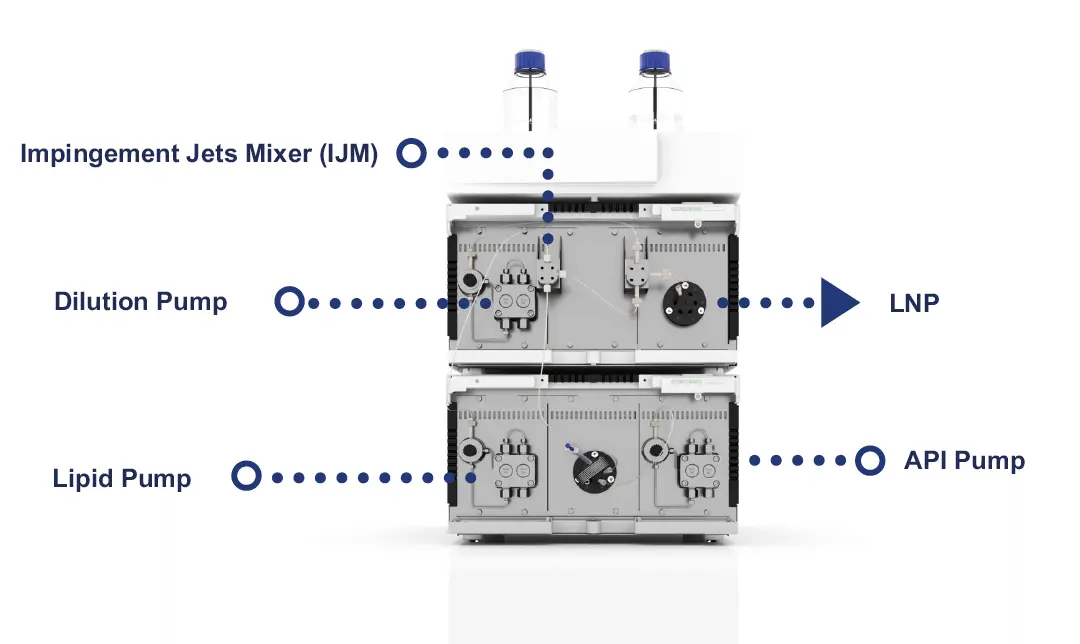
Fig. 1 Image of the KNAUER IJM NanoScaler
The formulation of LNPs was carried out using the LNP-0315 exploration kit (Cayman Chemical) and a NanoScaler (Fig. 1). The system consists of five Impingement Jets Mixers (IJMs), a lipid phase loop and three pumps. The ethanol pump empties the lipid phase loop and transports the lipid solution into the IJM where it meets the aqueous phase containing the API (active pharmaceutical ingredient). After passing through the IJM, the resulting emulsion can be diluted directly in the quench phase.
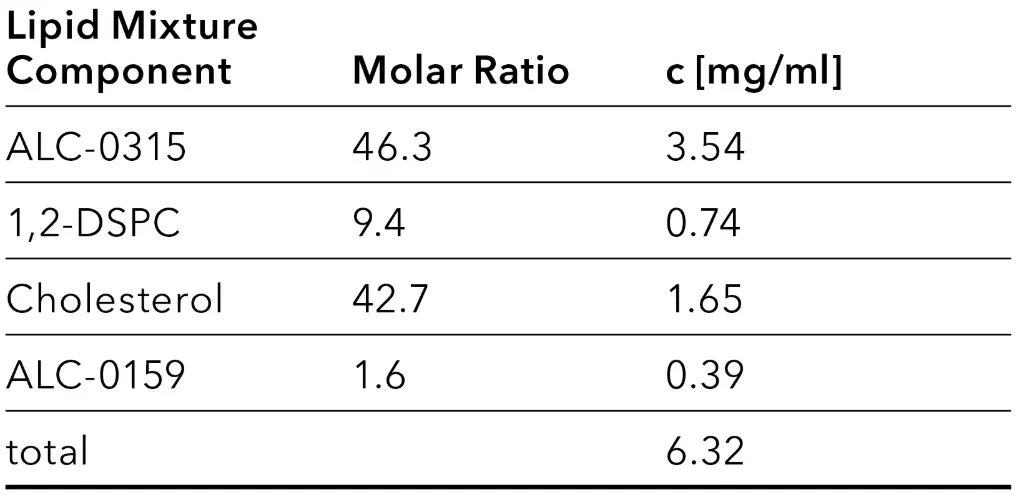
The lipid phase was prepared according to the manufacturer’s instructions (Tab. 1). The aqueous phase containing the oligonucleotides was prepared separately. For this purpose, a 50 mM sodium acetate solution with a pH value of 5 was prepared, in which 0.21 mg/ml polyadenylic acid (polyA) provided by Sigma-Aldrich were dissolved.
The Impingement Jets Mixer IJM2 was selected for turbulent mixing based on the desired flow rate. For formulation on the NanoScaler, a total flow rate of 6 ml/min and an organic:aqueous phase ratio of 1:3 were applied. After formulation, the LNP solutions were immediately diluted to an ethanol content of 10 %. The particle size and polydispersity index were then determined using dynamic light scattering (DLS).
Tab. 1 Composition of lipid mix stock solutions
Results
HPLC-MS/MS method development: lipids
Method development was started by optimizing MS-MS transitions of the parent lipids for multi reaction monitoring (MRM). Lipid solutions were diluted in mobile phase B (Tab. 7) and directly injected into the MS. After selecting the molecule peak from a Q1 scan for the following steps, the masses of two product ions were selected and the single reaction monitoring (SRM) parameters were optimized.
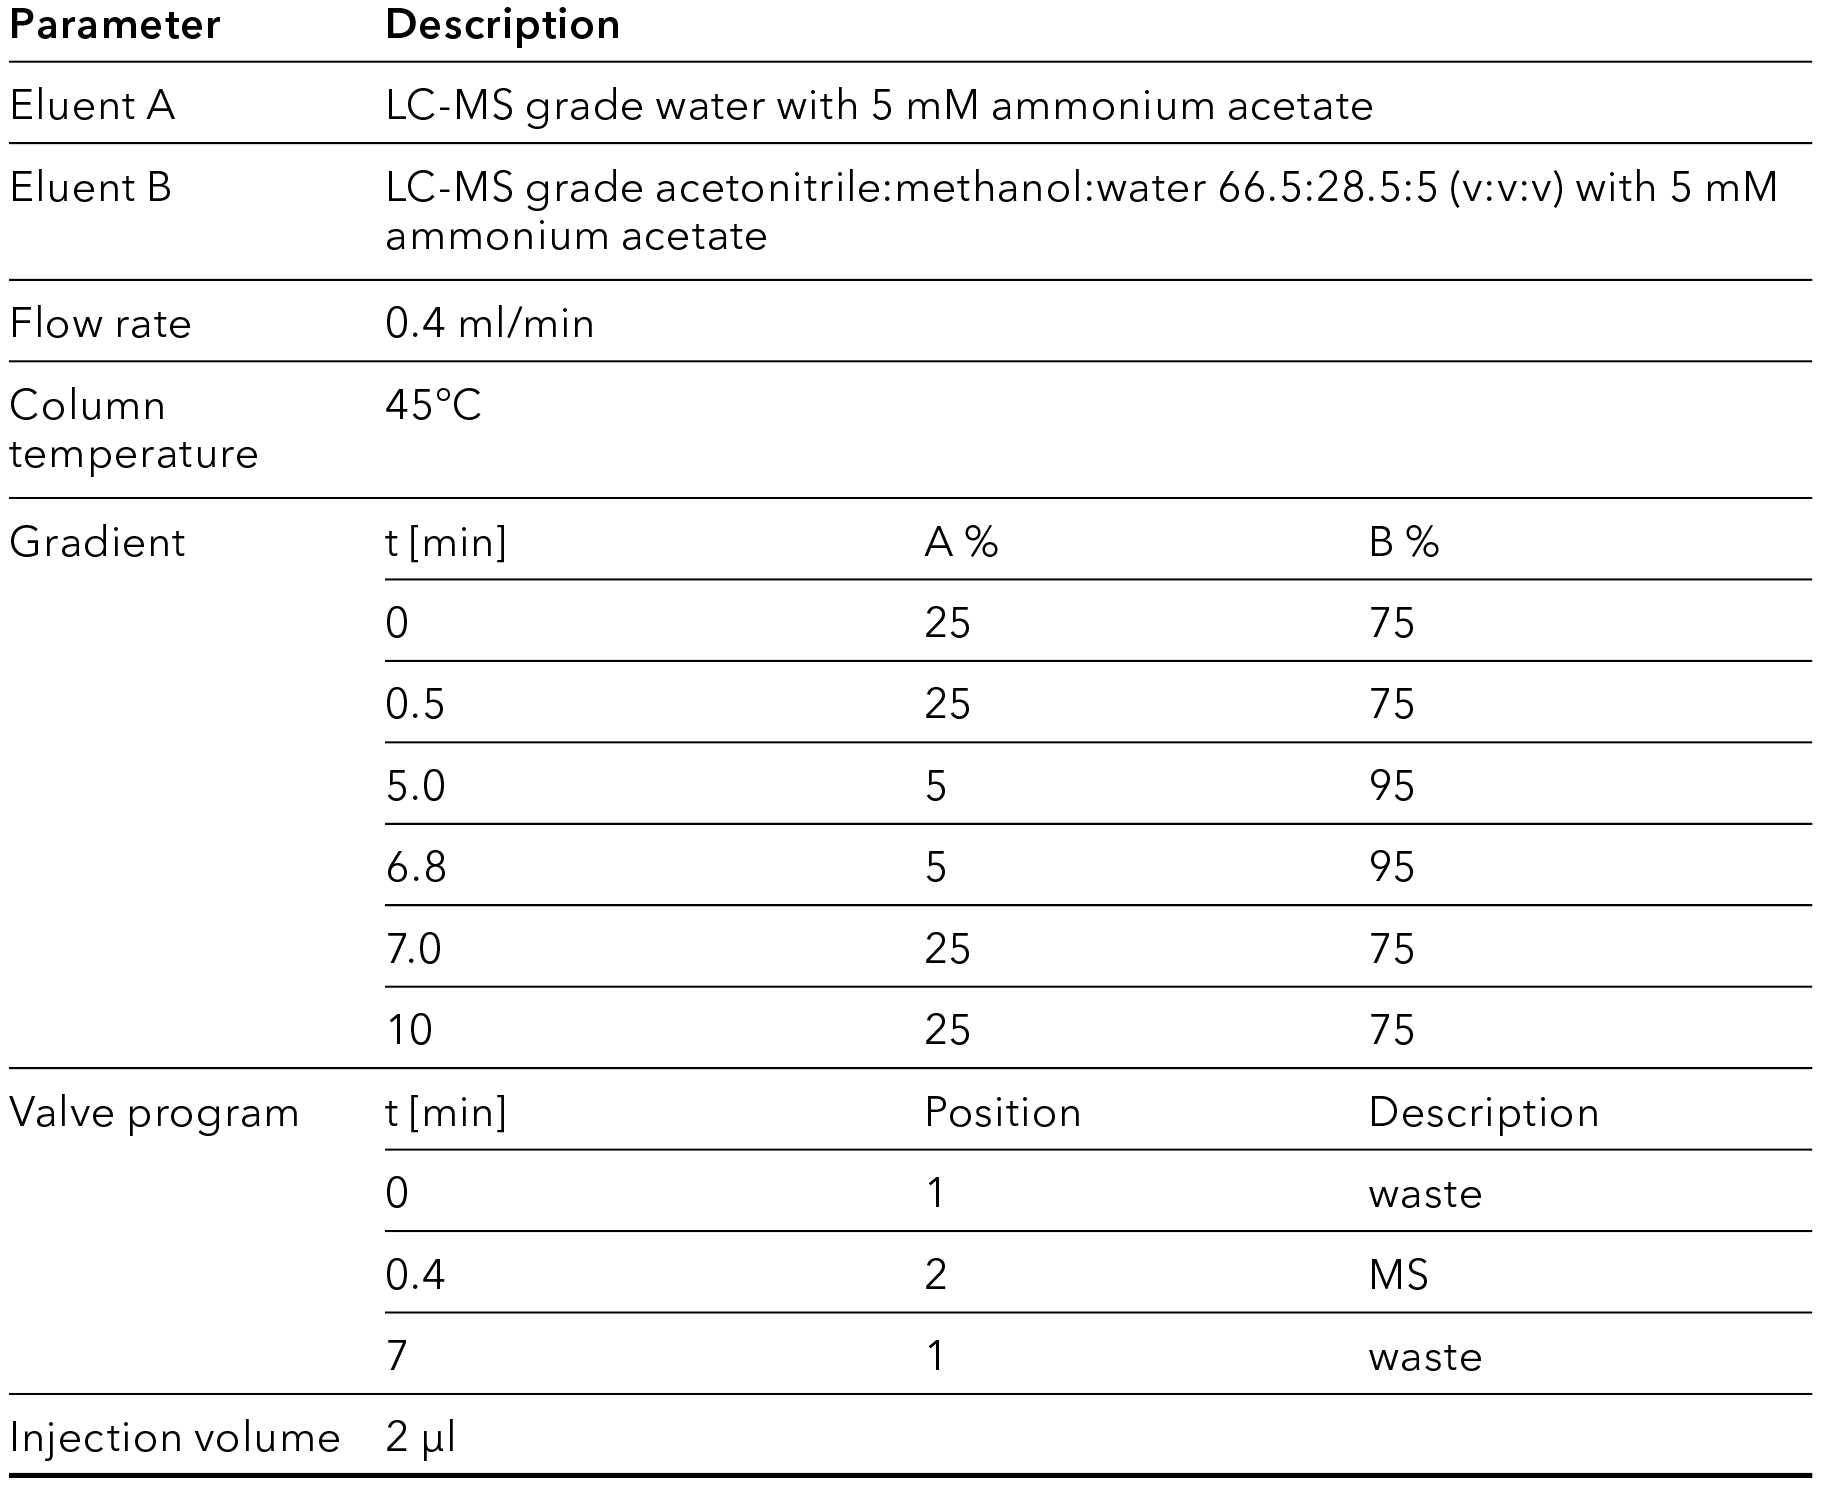
For the chromatographic separation, an LC method using a gradient with a mix of methanol and acetonitrile as eluent was adapted from the application note VPH0078 [2]. For lower noise and improved separation, the concentration of the modifier ammonium acetate was reduced to 5 mM. The method was transferred to the use of a binary pump by pre-mixing of the solvents of mobile phase B.
The source parameters were optimized using the LC system with column and a mix standard of the lipids. After optimization, the lipids of the vaccine BNT162b2 were separated and detected within their retention time windows (Fig. 2). A calibration of the lipids was performed to determine the linear response range for each lipid and to enable quantification (Tab. 2).
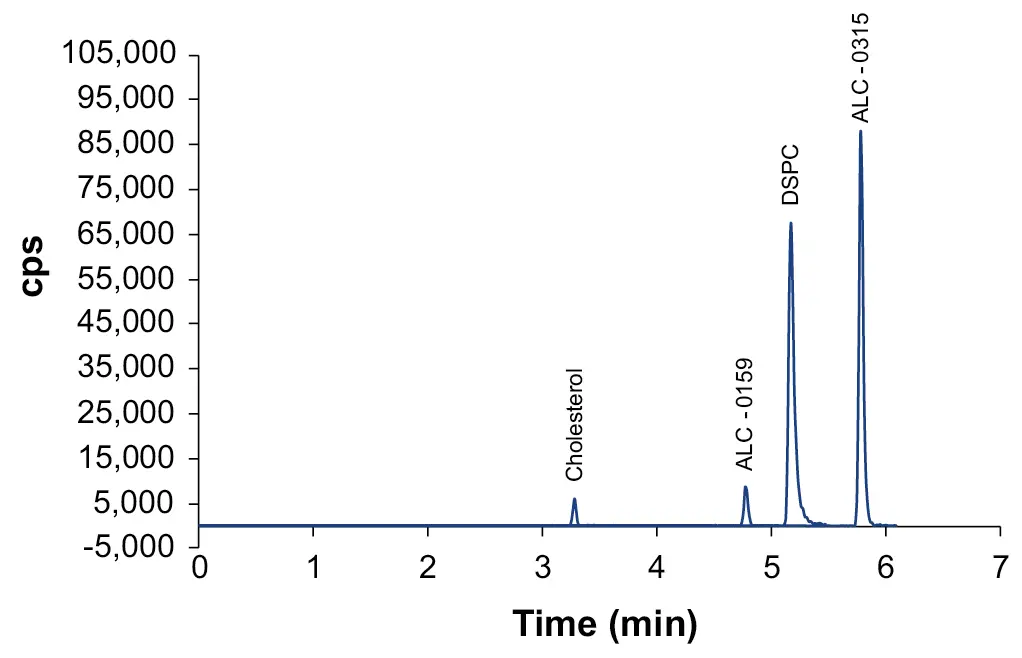
Fig. 2 Overlay of XIC of quantifier transitions for lipids of the vaccine BNT162b2.
Tab. 2 Lipid calibration: Linear range and coefficient of determination

HPLC-MS method development: impurities
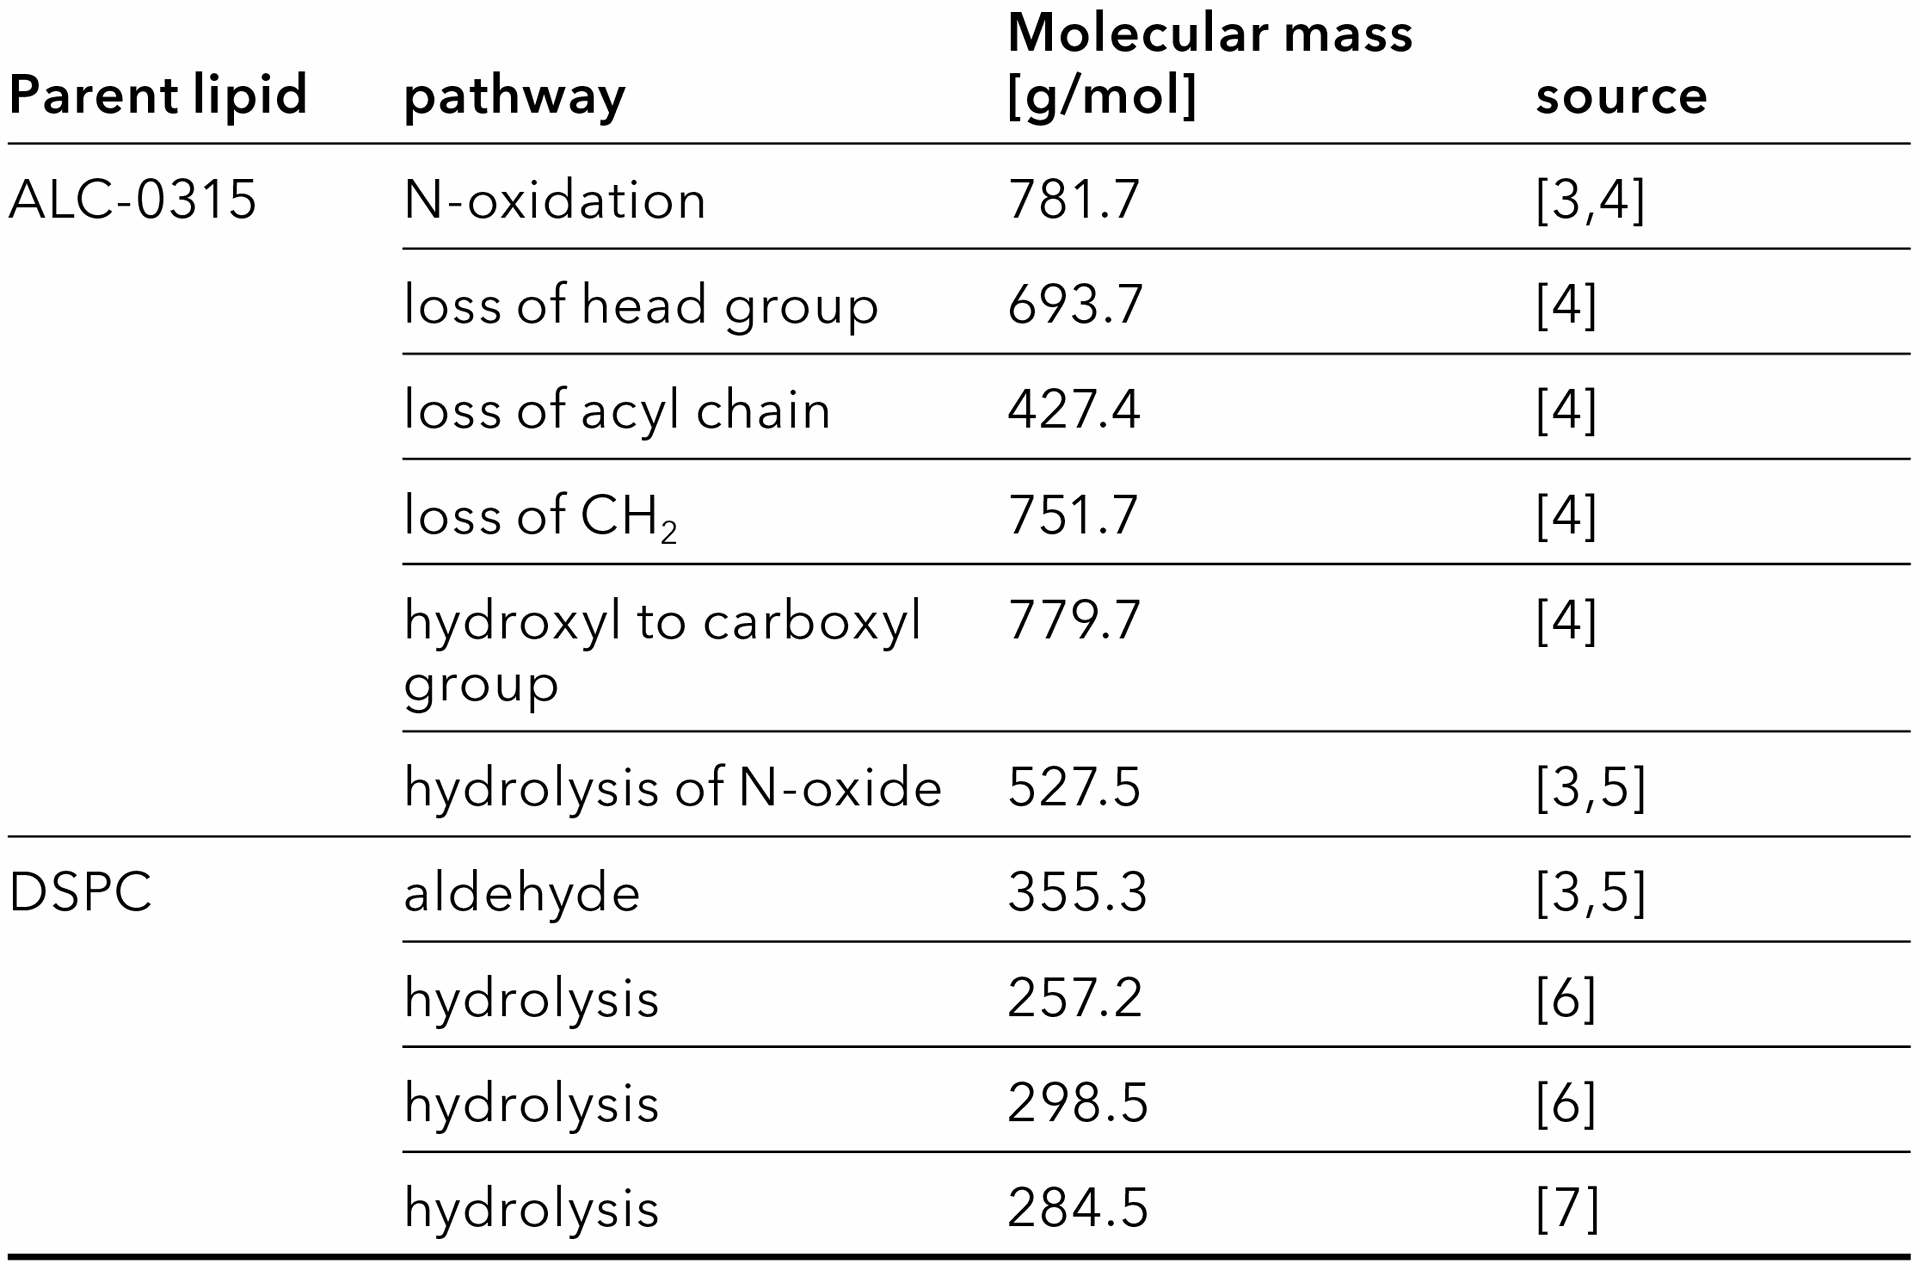
To detect possible impurities of the lipids as targeted analytes, expected masses were extracted from multiple sources of literature (Tab. 3). The N-oxides of ionizable or cationic lipids (e.g. ALC-0315) are of special concern, because they can form mRNA-reactive aldehydes [3]. The presence of ALC-0315 N-oxide or the derived aldehyde would therefore interfere with the drugs potency [3]. ALC-0315 N-oxide as well as many other ALC-0315 impurities can be ionized by positive electrospray ionization (ESI+) and are detected in MS [4], whereas the aldehyde can only be detected after derivatization [5]. DSPC is sensitive to hydrolysis and forms stearic acid or other hydrolysis products [6,7]. Cholesterol is considered stable [7]. No related impurities were monitored for this report. For the PEGylated lipid ALC-0159, no expected impurities were found in literature, whereas other PEGylated lipids can be hydrolyzed [7].
Tab. 3 Expected degradation pathways and impurities
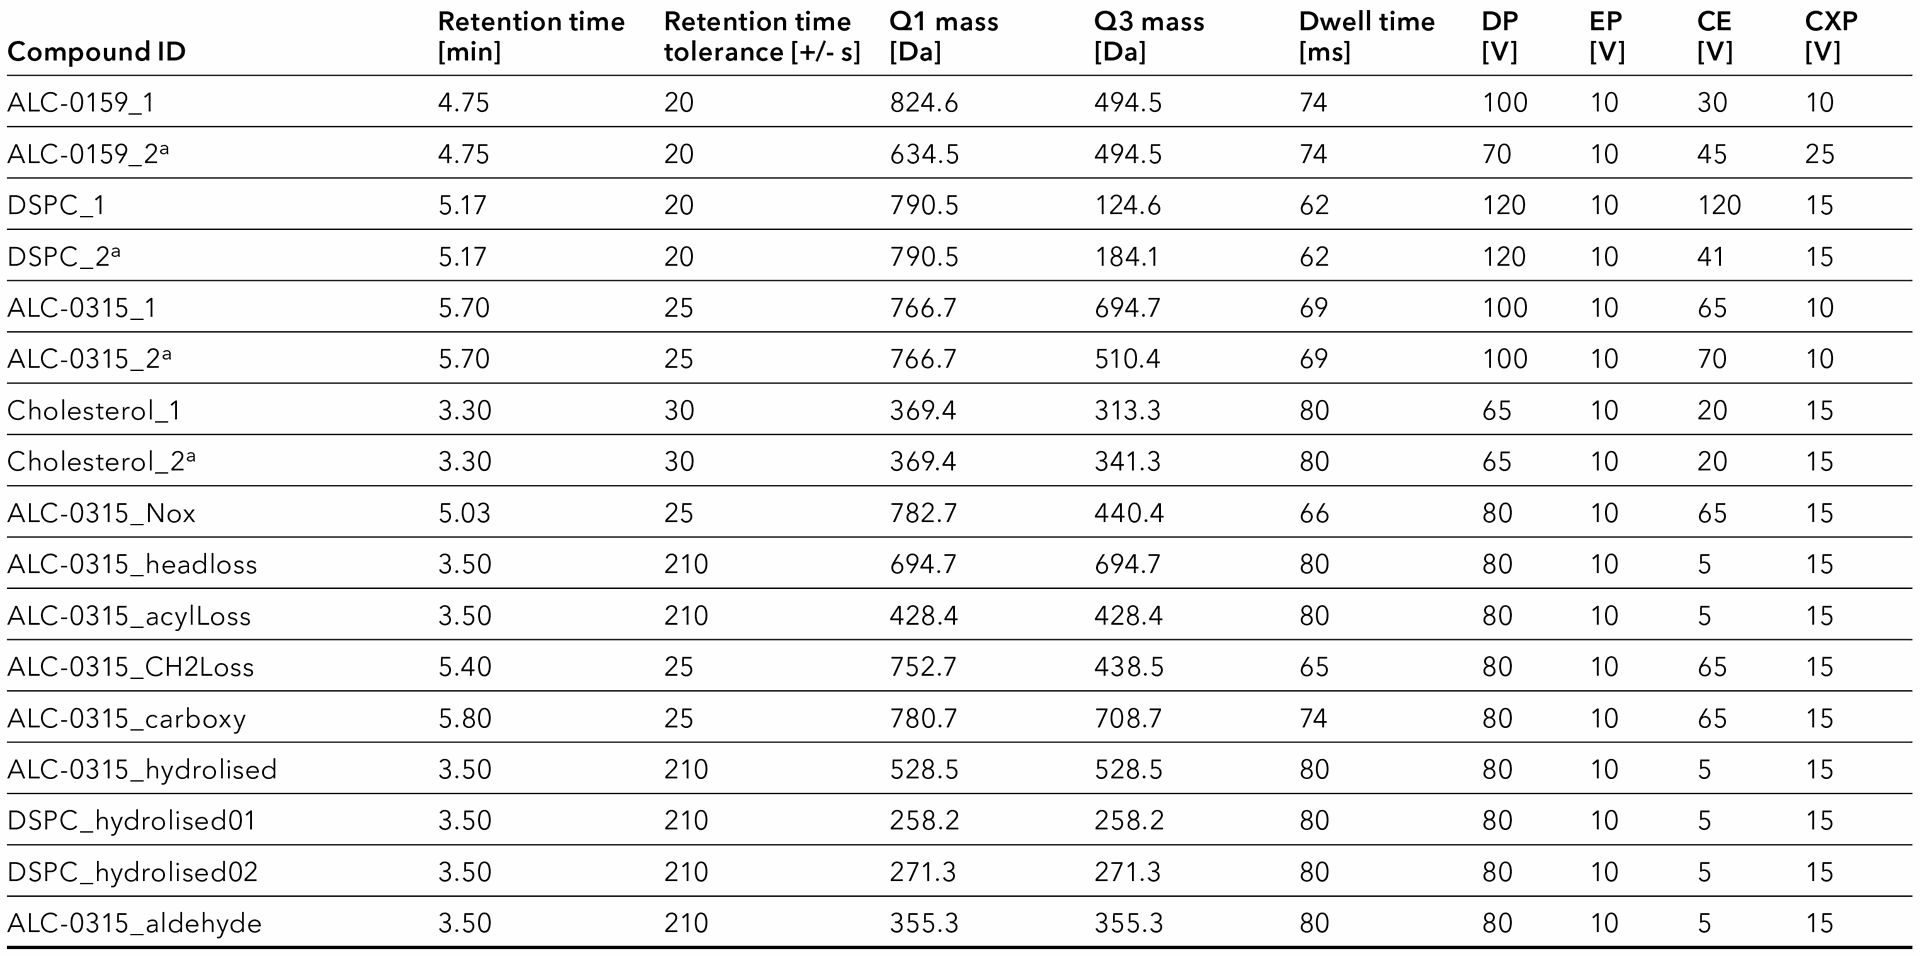
Most of the impurities are not available as a standard. To define MRM transitions for some, the lipid stock solutions were screened for their possible impurities instead (Fig. 3). Dilutions of single lipid standards were separated using the LC. Expected impurities were monitored in Q1MI experiments with m/z = M + 1 (ESI+) and m/z = M – 1 (ESI-). If an impurity was detected this way, a second separation with a product ion scan for the respective mass was performed. The fragments were assigned manually to ensure that the detected peak represents the expected impurity. If applicable, fragment spectra were compared with results from literature for confirmation, which were found e.g. in a Sciex technical note [4]. A suitable fragment mass was selected, and the transition and retention time was added to the MRM table (Tab. 6).

Fig. 3 Workflow for the selection of transitions for lipid impurities. A: Expected impurity, known from literature review [3,4]. B: Chromatogram of the parent lipid ALC-0315, detected in ESI+, Q1MI mode with Q1 mass = 782.7. Three peaks were found for the monitored mass. C: product ion spectrum for the peak highlighted in B. The fragmentation pattern is very similar to the one reported in [4]. This peak is therefore assigned as the problematic ALC-0315 N-oxide and the highlighted fragment mass is added to the MRM table. The other peaks are a different ALC-0315 oxide and an isotope peak of carboxylated ALC-0315 (M = 780.7, tR = 5.8 min).
In case an expected impurity was not found in the lipid stock solution, it was nevertheless added to the scheduled MRM table (Tab. 6). The expected retention time was set to 3.5 min and the retention time tolerance was set to 210 s to enable permanent monitoring (7 min gradient). Q1 was set to M + 1. Q3 was set to the same mass and the collision energy was set to the lowest possible value, allowing to detect the unfragmented molecule ion. In this way, the impurities can be monitored, even without a standard or a respective degradation of the parent lipid. If the impurity is found, for example, in a new batch of raw material or during a stability study, the fragment mass and retention time can still be added to the MRM table.
Some of the lipid impurities are available as a standard. Their MRM transitions can be optimized by direct injection, as shown above for the lipids. One example of an easily accessible impurity is stearic acid, which is formed during DSPC hydrolysis [7]. The fatty acid is only ionized by negative electrospray ionization. Therefore, a second MRM experiment with ESI- was added to the MS method. Because no fragment of stearic acid was detected in the product ion scan, the Q3 mass had to be equal to the Q1 mass for this impurity as well. After injection of the stearic acid standard, the retention time was specified in the processing method as 1.11 min. Because blank samples occasionally were tested false-positive for stearic acid, the impurity was not calibrated or evaluated in later experiments. Besides stearic acid, none of the expected degradation products of DSPC were detected in the lipid raw material.
Application example: formulated LNPs
Three batches of LNPs were formulated using the KNAUER IJM NanoScaler. Two batches of empty LNPs without API (LNP 01 and LNP 02) and one batch with encapsulated oligonucleotides (LNP polyA) were produced. For analysis of lipid recovery and the detection of impurities by HPLC-MS/MS, the LNPs were disrupted by diluting 25-fold in HPLC-grade ethanol. The efficiency of LNP disruption was confirmed through a DLS measurement (no or few particles with a diameter >5 nm should be detected). Two dilutions of each sample were injected. This allows to quantify the lipids which are detected with higher sensitivity in MS (DSPC, ALC-0315) as well as impurities or lipids with a low concentration in the LNP or lower MS sensitivity (ALC-0159 and cholesterol, respectively) within their linear range. Lipid recovery was 70 – 90 % and similar for all batches of LNPs (Fig. 4).
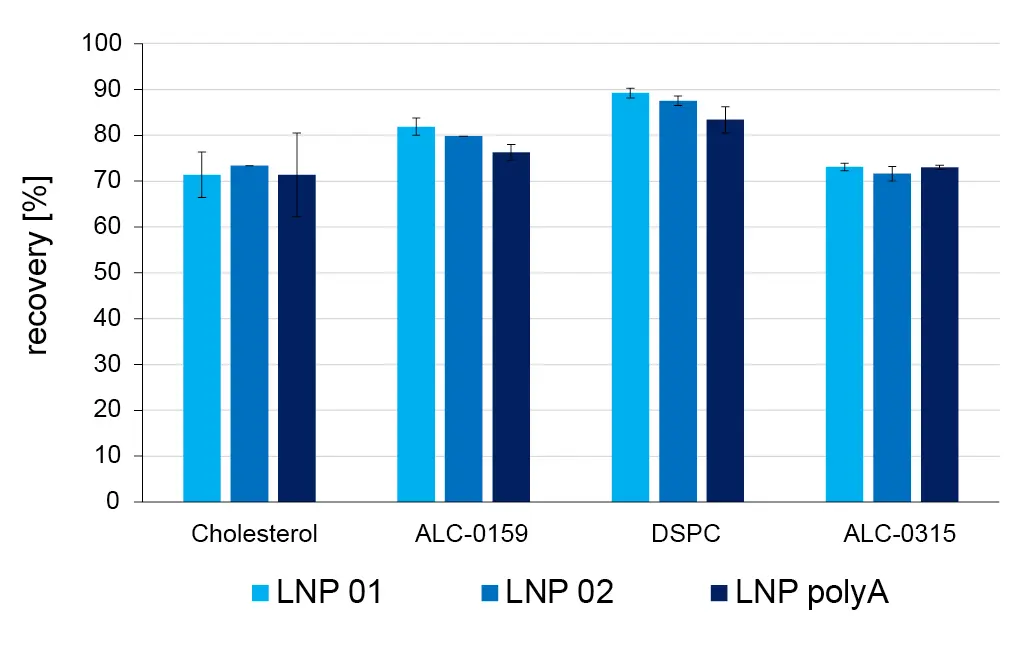
Fig. 4 Recovery of lipids in formulated LNPs in 10% ethanol, measured by HPLC-MS.
With the high-end KNAUER UHPLC system, high confidence in retention times was achieved. The chromatograms showed excellent reproducibility of retention times with a standard deviation of 0.03 % or 0.1 s, as shown below for the ALC-0315 quantifier transition (Fig. 5).
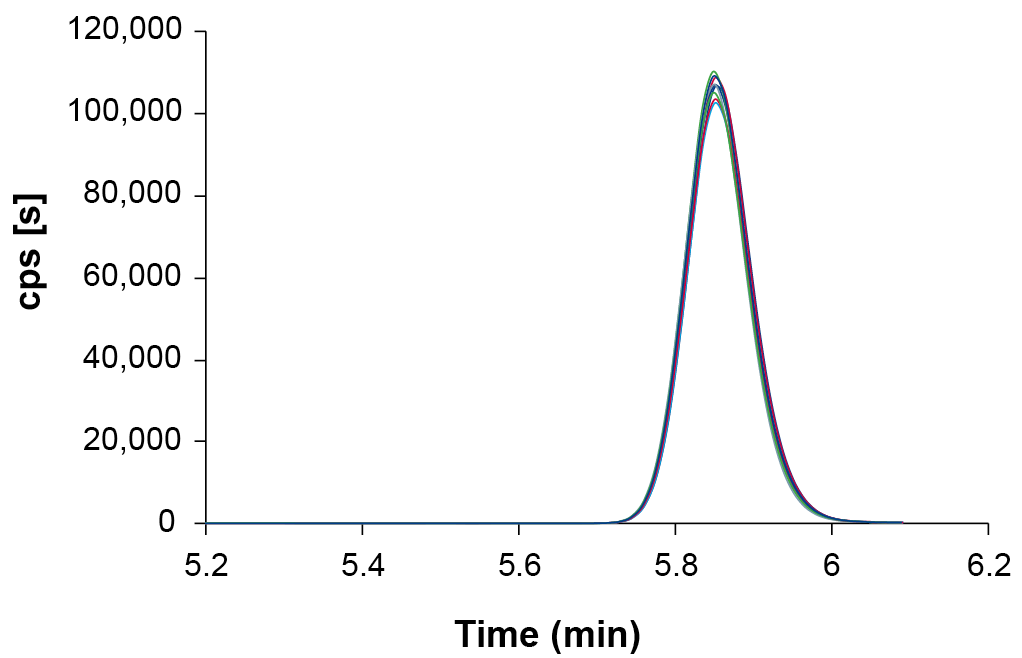
Fig. 5 Overlay of 9 Extracted Ion Chromatograms (XIC) of the ALC-0315 quantifier transition after Gaussian smoothing (2 points) detected in diluted LNP samples.
In the formulated LNPs, several ALC-0315 derived impurities were detected. All impurities for which transitions and retention times were identified from the raw material were found in the LNPs. Impurities with masses corresponding to ALC-0315 acyl loss (m/z = 428.4), hydrolysis (m/z = 528.5) and loss of head group (m/z = 694.7) were detected as well, even though they were only monitored based on their expected Q1 mass (Fig. 6B). As no absolute quantification was possible without a standard, the peak area relative to the parent lipid was evaluated (Fig. 7). The relative concentrations of each impurity were similar for the lipid phase before formulation and the three batches of formulated LNPs. This indicates that no additional impurities were formed during LNP formulation.
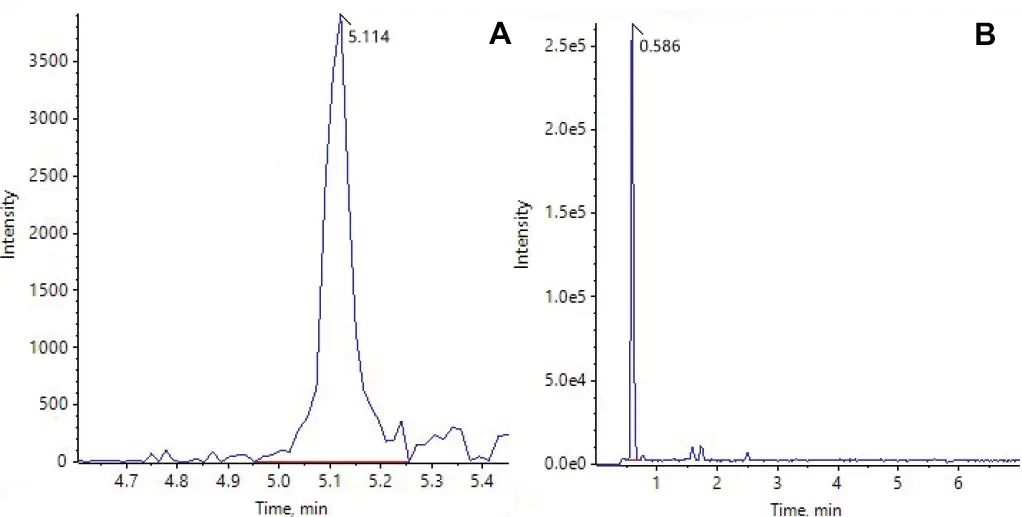
Fig. 6 Examples for Extracted Ion Chromatograms (XIC) of lipid impurities detected in LNPs. A: ALC-0315 N-oxide, monitored as scheduled MRM transition in a defined tR range. B: Impurity with a mass corresponding to hydrolyzed ALC-0315 (m/z = 528.5), monitored only as Q1 mass without a predefined time window.
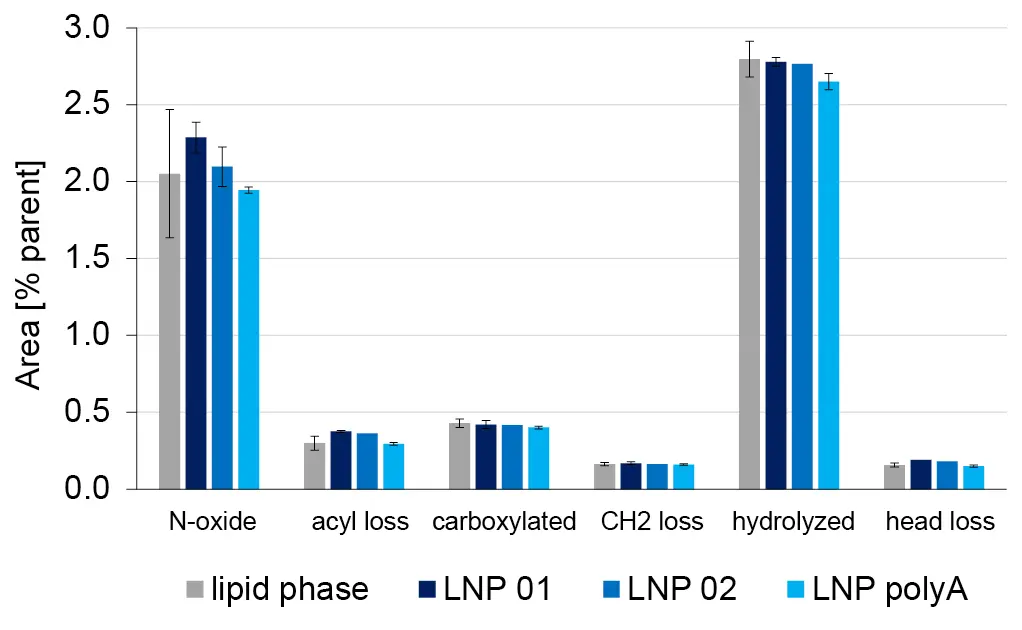
Fig. 7 Relative quantification of ALC-0315 derived impurities in 3 LNP formulations in 10 % ethanol.
For a short stability study, the LNP batches were divided into aliquots. Aliquots were stored at room temperature and at +7°C for one week. Samples of the aliquots were analyzed by HPLC-MS on the day of collection. The relative concentration of most impurities was approximately constant at room temperature and at +7°C, as shown for ALC-0315 after loss of a CH2 chain (Fig. 8). In contrast, the relative concentration of ALC-0315 N-oxide increased over time (Fig. 9). The increase was more pronounced in the LNPs with encapsulated oligonucleotides than in empty LNPs incubated at room temperature. The relative concentration of the N-oxide after 7 days of incubation was the same as the one of empty LNPs at room temperature for both empty and RNA-loaded LNPs. This indicates that the increase in N-oxide concentration on LNPs with polyA at room temperature beyond the effects observed at 7°C was caused by a chemical reaction rather than a physical effect. Apparently, the chosen storage conditions were not optimal to prevent lipid oxidation, which was brought to light with the suggested HPLC-MS/MS workflow.
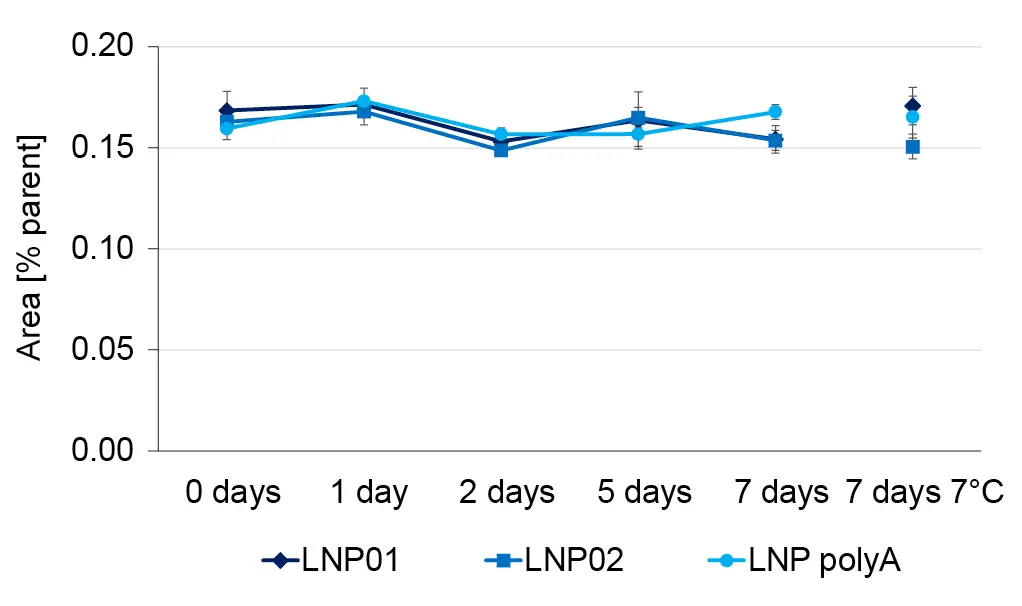
Fig. 8 The relative concentration of ALC-0315 CH2 loss is constant over time at room temperature and at 7°C.
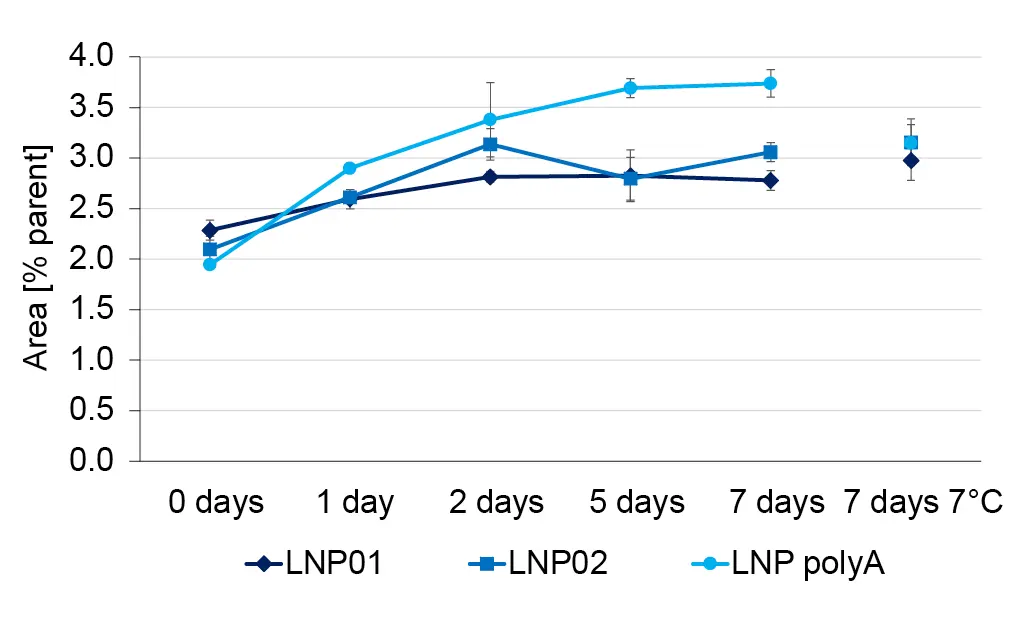
Fig. 9 The relative concentration of ALC-0315 N-oxide increases over time – especially in RNA loaded LNPs at room temperature.
Conclusion
With the workflow presented here, a MS/MS method for the quantification of lipids and detection of lipid impurities was developed. The method provides the flexibility to monitor targets that are available as a standard or present as impurities in raw materials, as well as targets that are initially not available. At the same time, lipids used for LNP formulations can be identified and quantified. The method was successfully applied to detect impurities and monitor the stability of LNPs formulated with the KNAUER IJM NanoScaler.
Material and Methods
Tab. 4 Instrument configuration
Instrument | Description | Article No. |
Pump | AZURA P 8.1L, HPG, 5 ml, 1240 bar | |
Autosampler | AZURA AS 6.1L, cool/heat, 1240 bar | |
Thermostat | AZURA CT 2.1 | |
LC Software | ClarityChrom® 9.0.0 - Workstation, autosampler control included | |
MS | Sciex Triple Quad™ 5500+ System – QTRAP® Ready | - |
MS Software | SCIEX OS 3.1 | - |
Column | Kinetex® 1.7 μm phenyl-hexyl 100 Å; 2.1x50 mm (Phenomenex Part No 00B-4500-AN) | - |
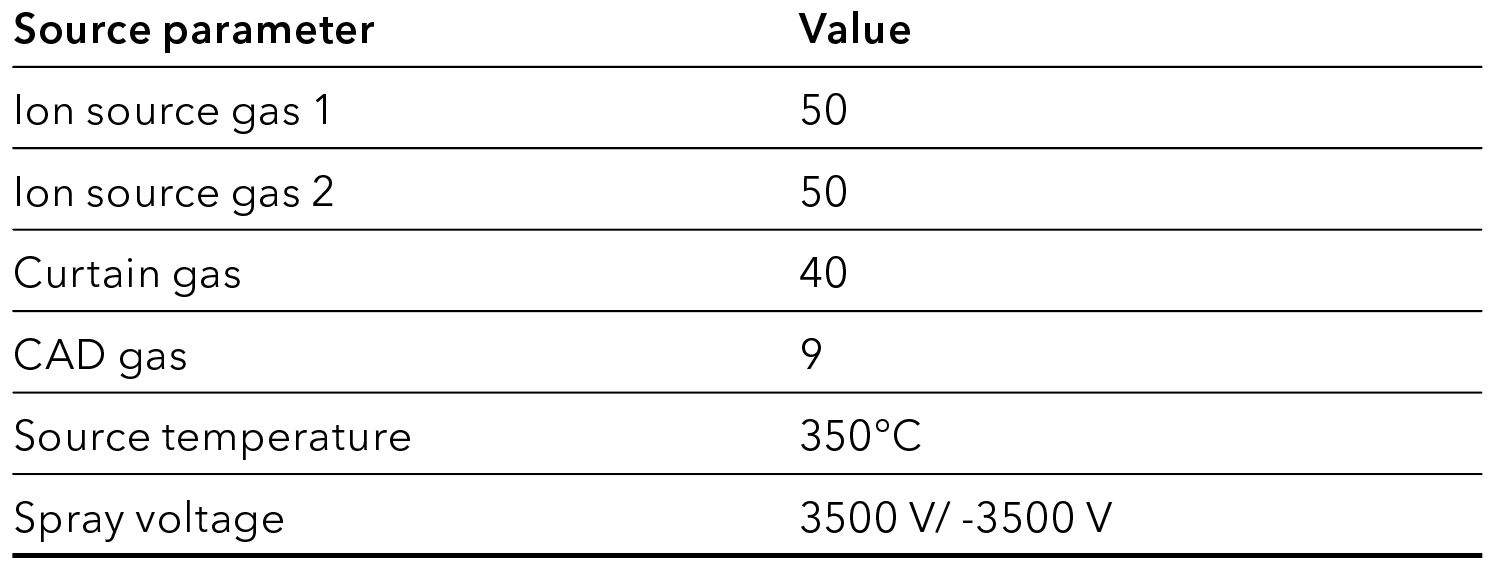
Tab. 5 MS source parameters
Tab. 6 MRM table for ESI+ experiments. a: Qualifiers.
Tab. 7 LC method parameters
References
[1] USP, Analytical Procedures for Quality of mRNA Vaccines and Therapeutics -Draft Guidelines: 3rd Edition, 2024.
[2] Prüfer, M., Greco, G. High-throughput and sensitive HPLC analysis of lipids used in LNP formulations with evaporative light scattering detection. KNAUER AppNote VPH0078, 2024.
[3] Packer, M., Gyawali, D., Yerabolu, R., Schariter, J., White, P. Nat Commun 2021, 12.
[4] Yang, Z., Baker, P., Mollah, S., Proos, R., Le Huray, J. Structural characterization of the cationic lipid nanoparticle component, ALC-0315, and its impurities using electron-activated dissociation (EAD)-based MS/MS fragmentation Featuring the ZenoTOF 7600 system. Sciex AppNote MKT-26966-A, 2023.
[5] Birdsall, R. E., Han, D., DeLaney, K., Kowalczyk, A., Cojocaru, R., Lauber, M., Huray, J. Le J Chromatogr B Analyt Technol Biomed Life Sci 2024, 1234.
[6] Han, D., DeLaney, K., Alden, B. A., Birdsall, R. E., Qing Yu, Y. Lipid Nanoparticle Analysis: Leveraging MS to Reduce Risk. Waters AppNote 720007716, 2022.
[7] Mousli, Y., Brachet, M., Chain, J. L., Ferey, L. J Pharm Biomed Anal 2022, 220, 115011.
Application details
Method | LC-MS |
Mode | RP |
Substances | Cholesterol, DSPC, ALC-0315, ALC-0159, ALC-0315 N-oxide |
CAS number | 57-88-5, 816-94-4, 2036272-55-4, 1849616-42-7 |
Version | Application No.: VPH0083 Version 1 / 11/2024 | ©KNAUER Wissenschaftliche Geräte GmbH |

